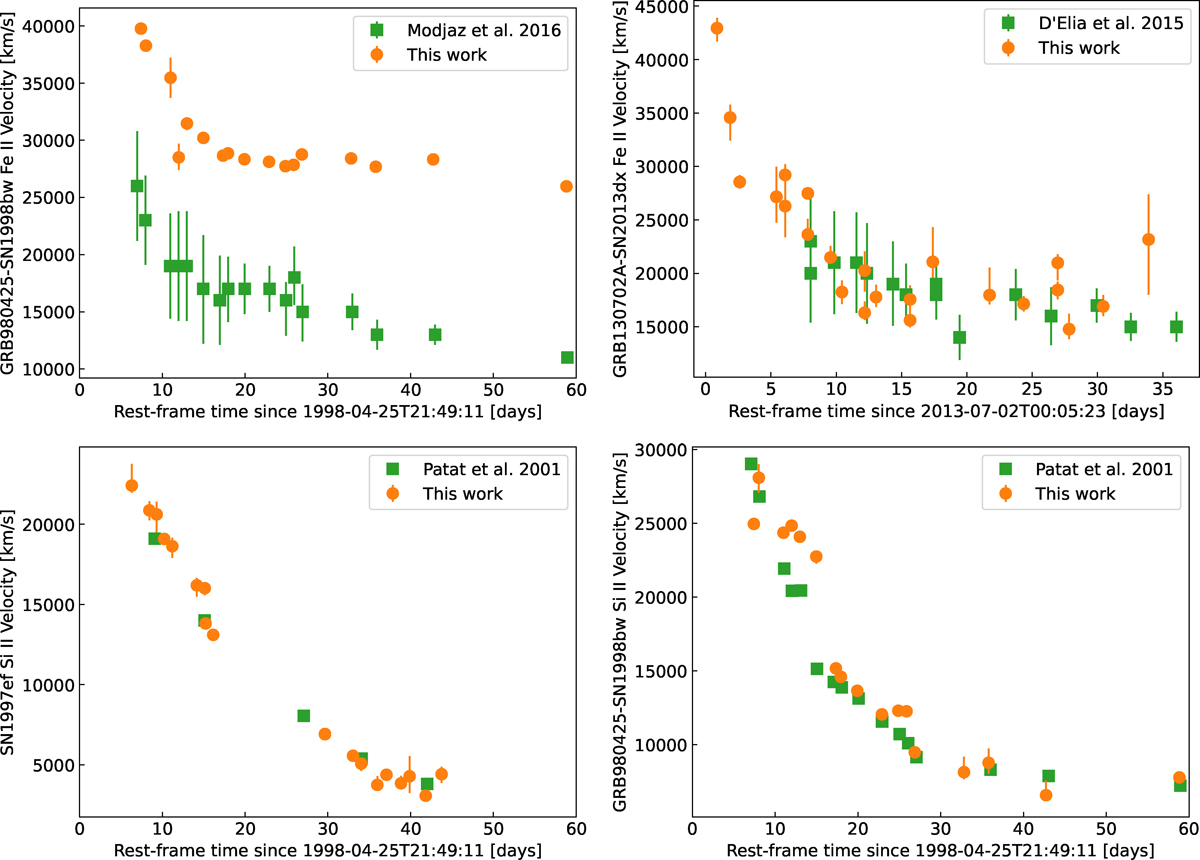
Fig. 26.
Download original image
Comparison of SN velocities derived from the minima of absorption features in this work (orange circles) with SN velocities from the literature (green squares). Top left: Fe II velocities of GRB980425-SN1998bw. The literature data is from Modjaz et al. (2016), who use a custom velocity determination method in which a blue-shifted and convolved type Ic template spectrum is fit to the type Ic-BL spectrum in order to determine the Fe II velocity. This is intended to handle the issue of rest-wavelength assignment for a heavily blended feature. In this instance, there is a clear disparity between the velocities measured by both methods. This type of disparity was observed by Modjaz et al. (2016). A possible explanation for this is that Fe II 5169 Å may not be the dominant Fe line in this feature for this SN. Consequently, using the wavelength of the minimum flux of the feature with Eq. (B.1) leads to an over-estimate of the velocity. The discrepancy in this case is approximately 12 000 km/s, which suggests that Fe II 4924 Å or 5018 Å may be the dominant lines in this feature, and it is their velocities that are being (erroneously) inferred from the minimum flux wavelength. Top right: Fe II velocities of GRB130702A-SN2013dx. The literature data is from D’Elia et al. (2015), who use the method proposed by Modjaz et al. (2016). A much better agreement between methods is observed in this case, implying that the minimum of this Fe feature is strongly influenced by Fe II 5169 Å. Bottom left: Si II velocities of SN1997ef. Literature data are from Patat et al. (2001), who obtained the Si II velocity from the minimum flux wavelength of the Si II 6355 Å feature. As expected, the results of both methods show excellent agreement. Bottom right: Si II velocities of GRB980425-SN1998bw. Literature data are from Patat et al. (2001), who obtained the Si II velocity from the minimum flux wavelength of the Si II 6355 Å feature. As expected, the results of both methods show excellent agreement.
Current usage metrics show cumulative count of Article Views (full-text article views including HTML views, PDF and ePub downloads, according to the available data) and Abstracts Views on Vision4Press platform.
Data correspond to usage on the plateform after 2015. The current usage metrics is available 48-96 hours after online publication and is updated daily on week days.
Initial download of the metrics may take a while.