Fig. 3.
Download original image
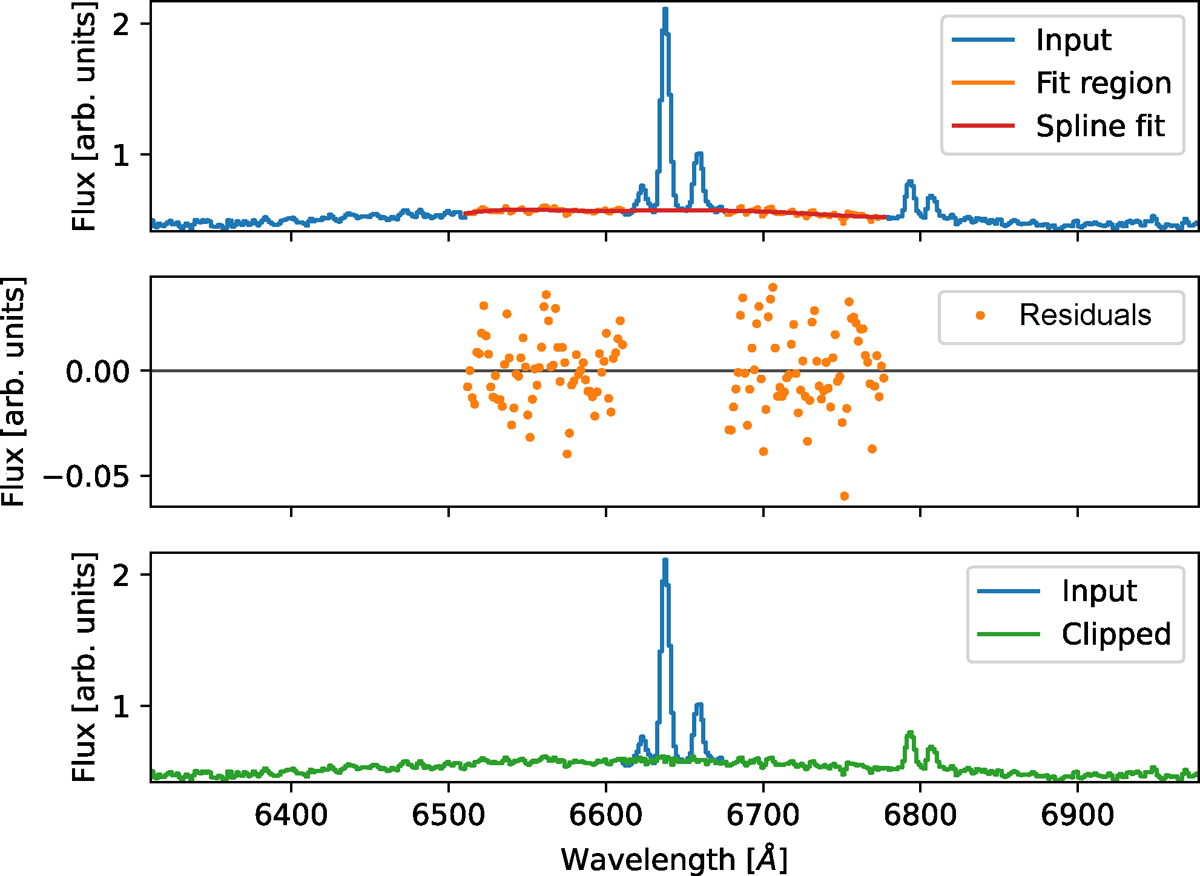
Emission line removal using the emlineclipper Python code. Line selection was performed manually by selecting the bounding region around the emission lines. The data in a small range on each side of the emission line region were fit using a spline. The mean and standard deviation of the spline fit residuals in this region were used to resample the flux in the emission line region.
Current usage metrics show cumulative count of Article Views (full-text article views including HTML views, PDF and ePub downloads, according to the available data) and Abstracts Views on Vision4Press platform.
Data correspond to usage on the plateform after 2015. The current usage metrics is available 48-96 hours after online publication and is updated daily on week days.
Initial download of the metrics may take a while.