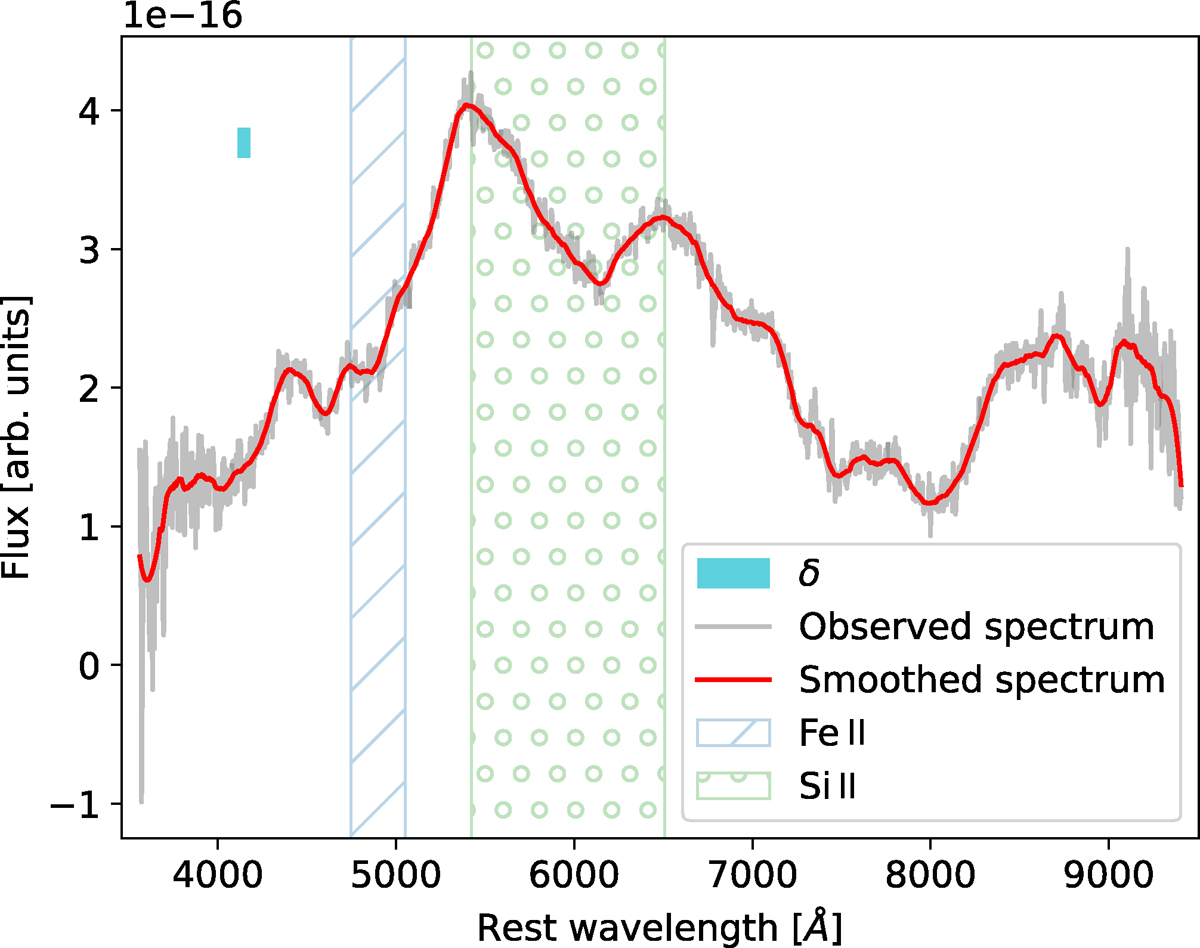
Fig. 4.
Download original image
Selection of the initial boundaries for the Fe II (5169 Å) and Si II (6355 Å) features in a spectrum of SN2020bvc. The ‘observed spectrum’ (grey) is the raw SN spectrum following redshift and emission line corrections. The ‘smoothed spectrum’ (red) is the SG-filtered observed spectrum. The hatched Fe and Si regions denote the user-selected regions in which to perform the spline fit for these features. The final boundaries of the fitting regions were allowed to vary by δ resolution elements with respect to the initial boundaries.
Current usage metrics show cumulative count of Article Views (full-text article views including HTML views, PDF and ePub downloads, according to the available data) and Abstracts Views on Vision4Press platform.
Data correspond to usage on the plateform after 2015. The current usage metrics is available 48-96 hours after online publication and is updated daily on week days.
Initial download of the metrics may take a while.