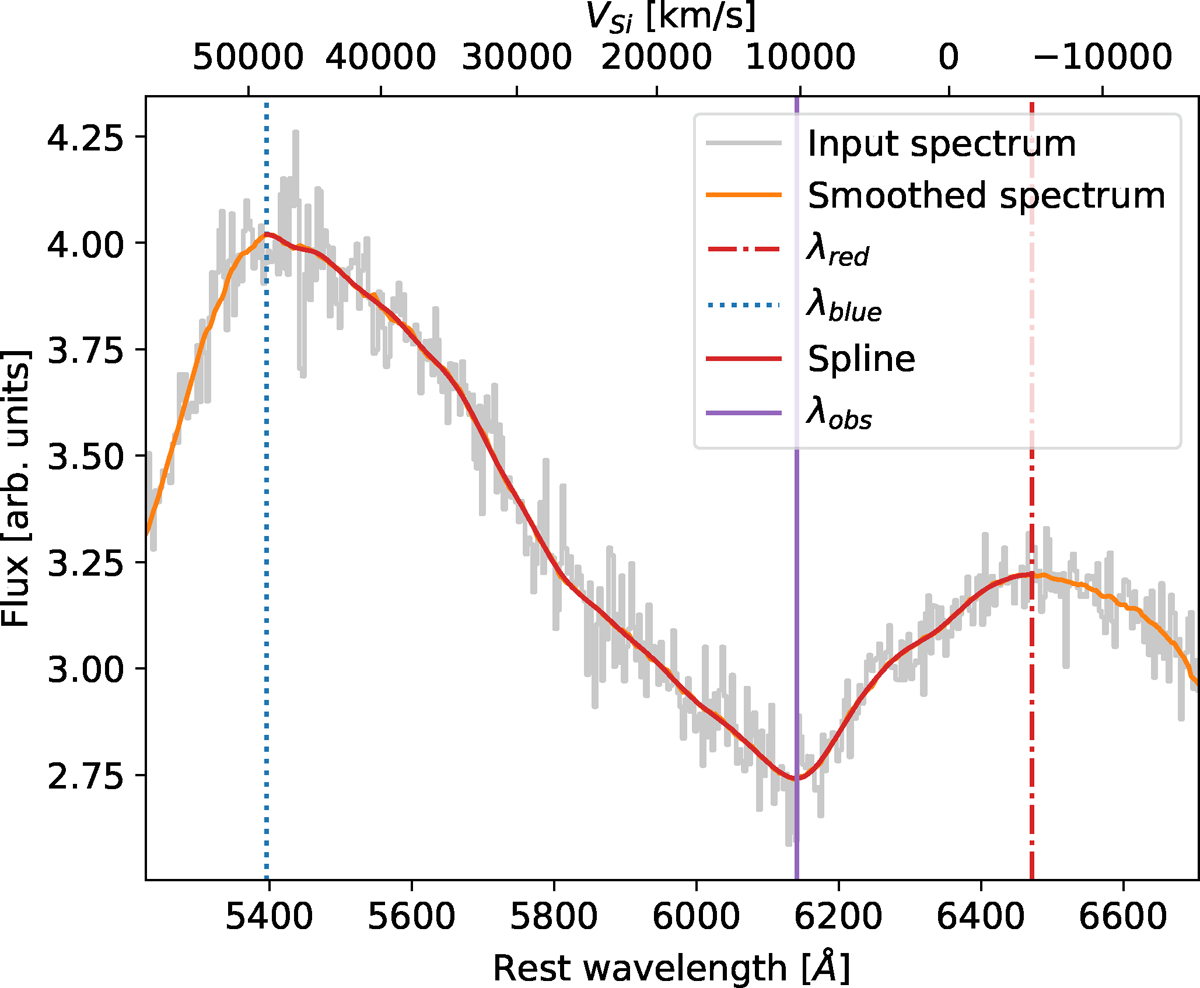
Fig. 5.
Download original image
Spline fit to the Si II feature of 2020bvc. The wavelength at which the spline fit reaches its minimum value is used in the Doppler formula to compute the expansion velocity of the feature. The ‘input spectrum’ (shown in grey) was generated by adding random noise to the SG-filtered observed spectrum (i.e. the reduced 1D spectrum from the source catalogue). The solid orange line represents the ‘smoothed spectrum’, created by applying an SG filter to the input spectrum. A solid red line illustrates the ‘spline fit’ applied to the smoothed spectrum between the wavelengths λblue and λred. The wavelength at which the spline fit reaches its minimum was taken as the observed wavelength of the feature and is denoted as λobs (purple line).
Current usage metrics show cumulative count of Article Views (full-text article views including HTML views, PDF and ePub downloads, according to the available data) and Abstracts Views on Vision4Press platform.
Data correspond to usage on the plateform after 2015. The current usage metrics is available 48-96 hours after online publication and is updated daily on week days.
Initial download of the metrics may take a while.