Fig. 6.
Download original image
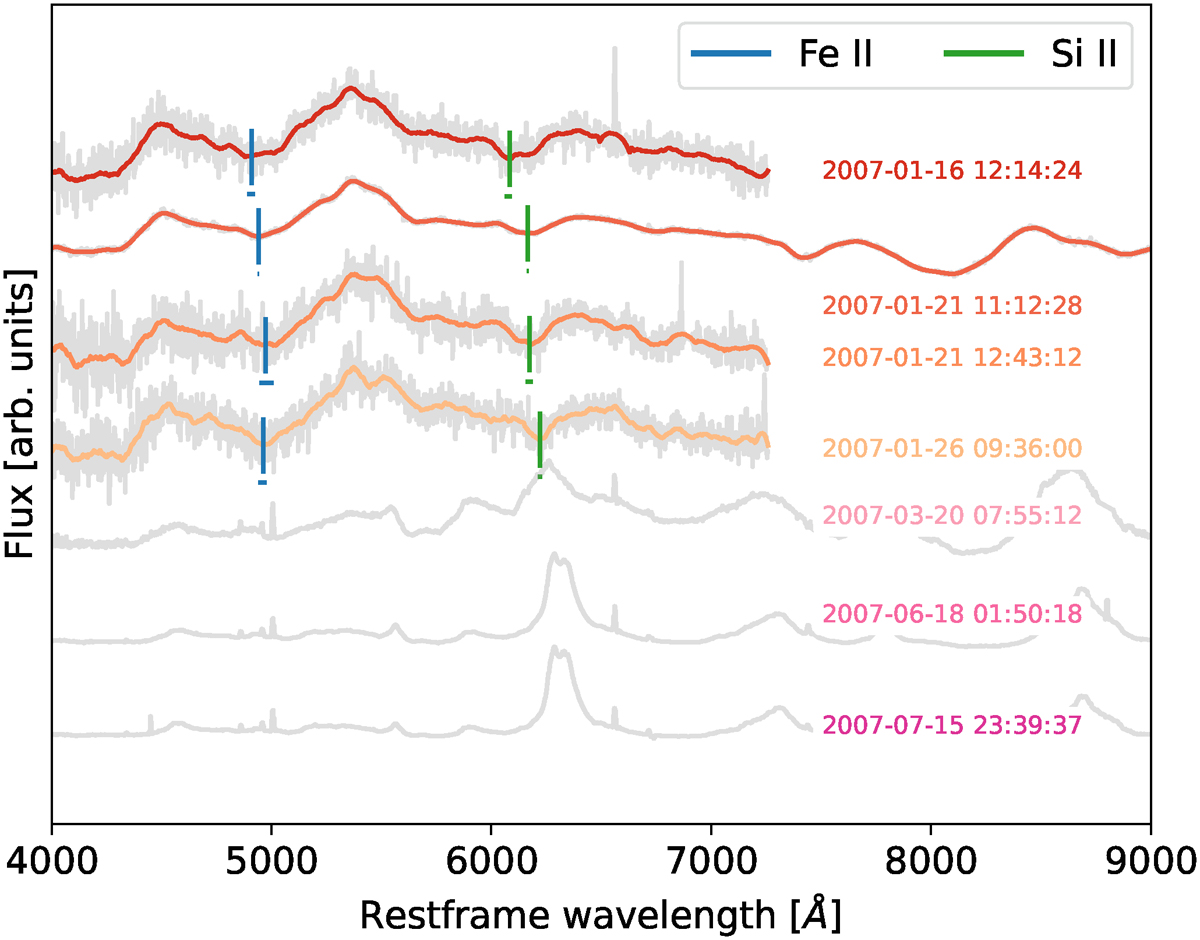
Spectral sequence of the type Ic-BL SN SN2007D. The observed spectra (grey) and smoothed spectra (multiple colours) are plotted as solid lines. Also shown are the determined minimum wavelengths of the Fe II (blue) and Si II (green) features, as well as the corresponding uncertainty on the minimum wavelength, which is influenced by the S/N of the spectrum. A trend of increasing minimum wavelength with time is visible for Fe II and Si II; this is a direct result of the deceleration of the SN ejecta. This plot was generated for each SN in the sample and was used to verify the feature selection and to classify nebular spectra. The last three spectra were classified as nebular, as they have a relatively flat continuum and a strong emission feature near 6300 Å. These spectra were obtained from WISeREP and come from Modjaz et al. (2014), Shivvers et al. (2019).
Current usage metrics show cumulative count of Article Views (full-text article views including HTML views, PDF and ePub downloads, according to the available data) and Abstracts Views on Vision4Press platform.
Data correspond to usage on the plateform after 2015. The current usage metrics is available 48-96 hours after online publication and is updated daily on week days.
Initial download of the metrics may take a while.