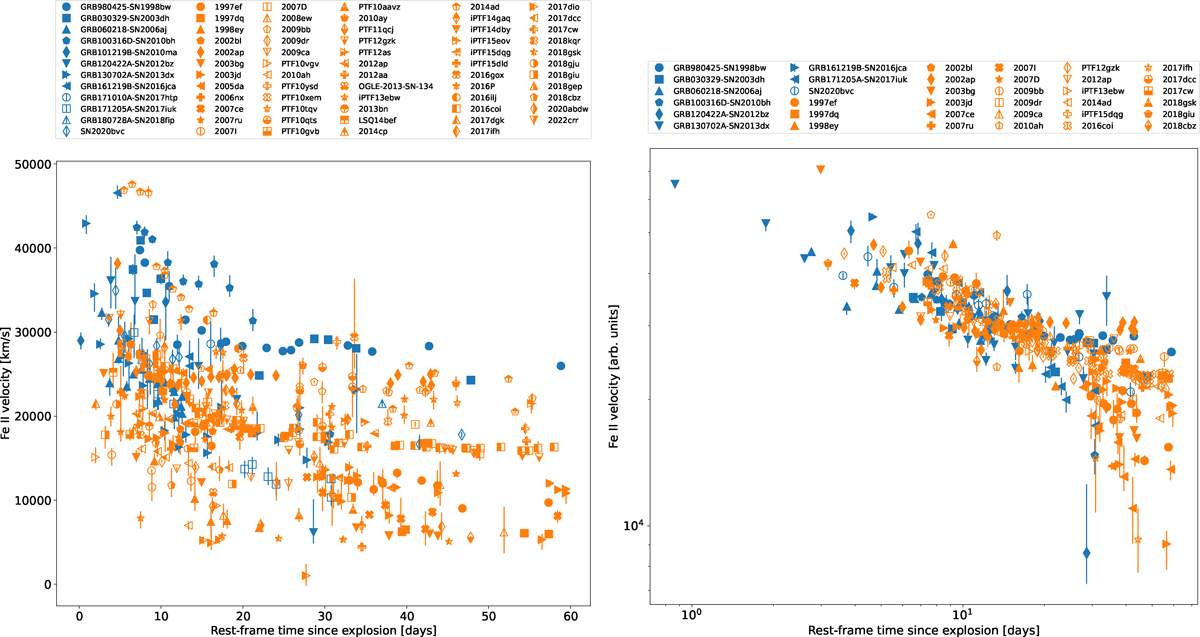
Fig. 7.
Download original image
Velocity evolution of the Fe II feature. Left: Plot of all SNe in the sample for which Fe II velocities were measured. All SNe follow a rapid decay at early times (< 20 days) before beginning to plateau. A continuum of velocities exists for ordinary type Ic-BL SNe and GRB-SNe. Right: Selection of SNe for which the velocity evolution has been fitted. The velocities have been scaled to highlight the overall trend. The scaling factor is computed from the fitted velocity at 15 days divided by the fitted velocity of GRB980425-SN1998bw at 15 days. The majority show a power law trend, with others showing broken power law trends. There are no evolutionary differences between the ordinary type Ic-BL SN and GRB-SN samples.
Current usage metrics show cumulative count of Article Views (full-text article views including HTML views, PDF and ePub downloads, according to the available data) and Abstracts Views on Vision4Press platform.
Data correspond to usage on the plateform after 2015. The current usage metrics is available 48-96 hours after online publication and is updated daily on week days.
Initial download of the metrics may take a while.