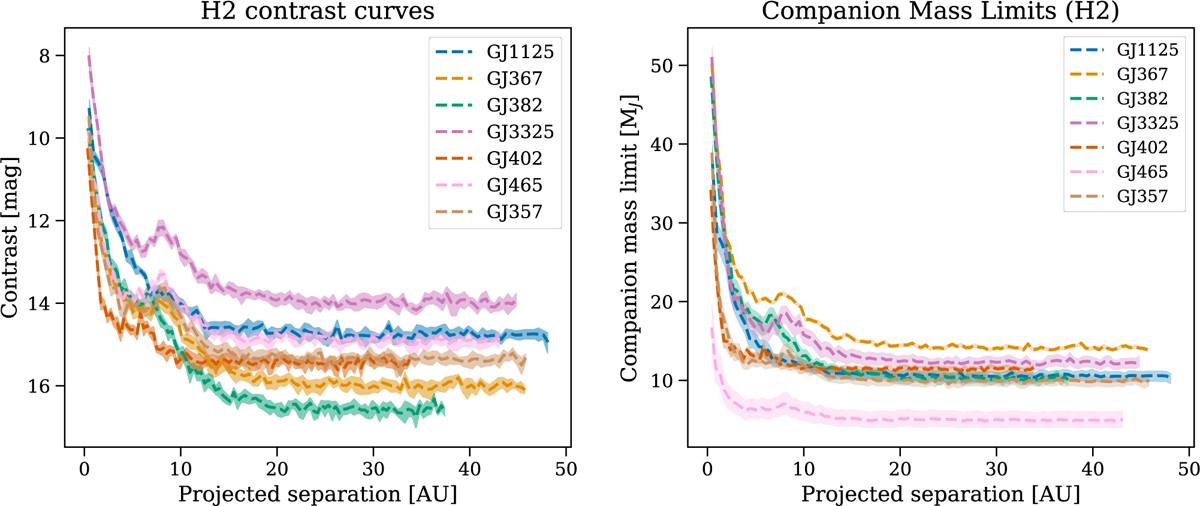
Fig. 1
Download original image
Left: contrast curves computed from the SPHERE H2 high contrast images. The rise in most contrast curves at around 1 arcsec (converted to physical scale) corresponds to the limit of the AO correction (0.8 arcsec; Fusco et al. 2006, 2016). The reached contrast in the H2 band and H3 band (not plotted here) is almost identical. Right: mass limits derived from the SPHERE H2 contrast curves in above using the AMES-Cond evolutionary models (Baraffe et al. 2003). The shaded regions show the possible spread due to the uncertainty on the stellar ages. We note that the mass limits obtained in the H2 filter are a factor ∼2 better than in the H3 filter.
Current usage metrics show cumulative count of Article Views (full-text article views including HTML views, PDF and ePub downloads, according to the available data) and Abstracts Views on Vision4Press platform.
Data correspond to usage on the plateform after 2015. The current usage metrics is available 48-96 hours after online publication and is updated daily on week days.
Initial download of the metrics may take a while.