Fig. 3
Download original image
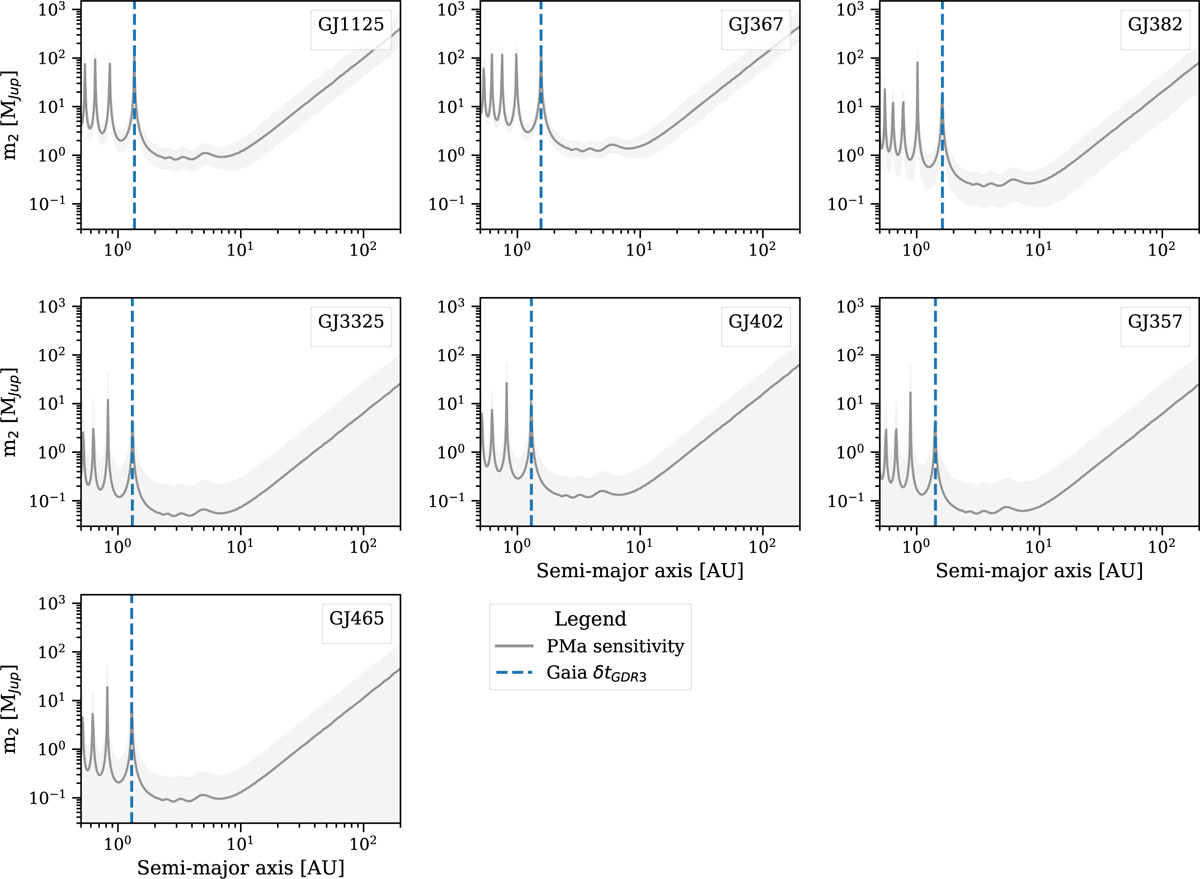
PMa sensitivity limits (grey) computed for the seven targets present in both the HIPPARCOS and Gaia EDR3 catalogues (see Sect. 3.3 for details). The shaded region corresponds to the 1 σ uncertainty. The dashed blue line indicates the semi-major axis corresponding to the observing window for the Gaia DR3 mission δtGDR3 = 1038d.
Current usage metrics show cumulative count of Article Views (full-text article views including HTML views, PDF and ePub downloads, according to the available data) and Abstracts Views on Vision4Press platform.
Data correspond to usage on the plateform after 2015. The current usage metrics is available 48-96 hours after online publication and is updated daily on week days.
Initial download of the metrics may take a while.