Fig. 9
Download original image
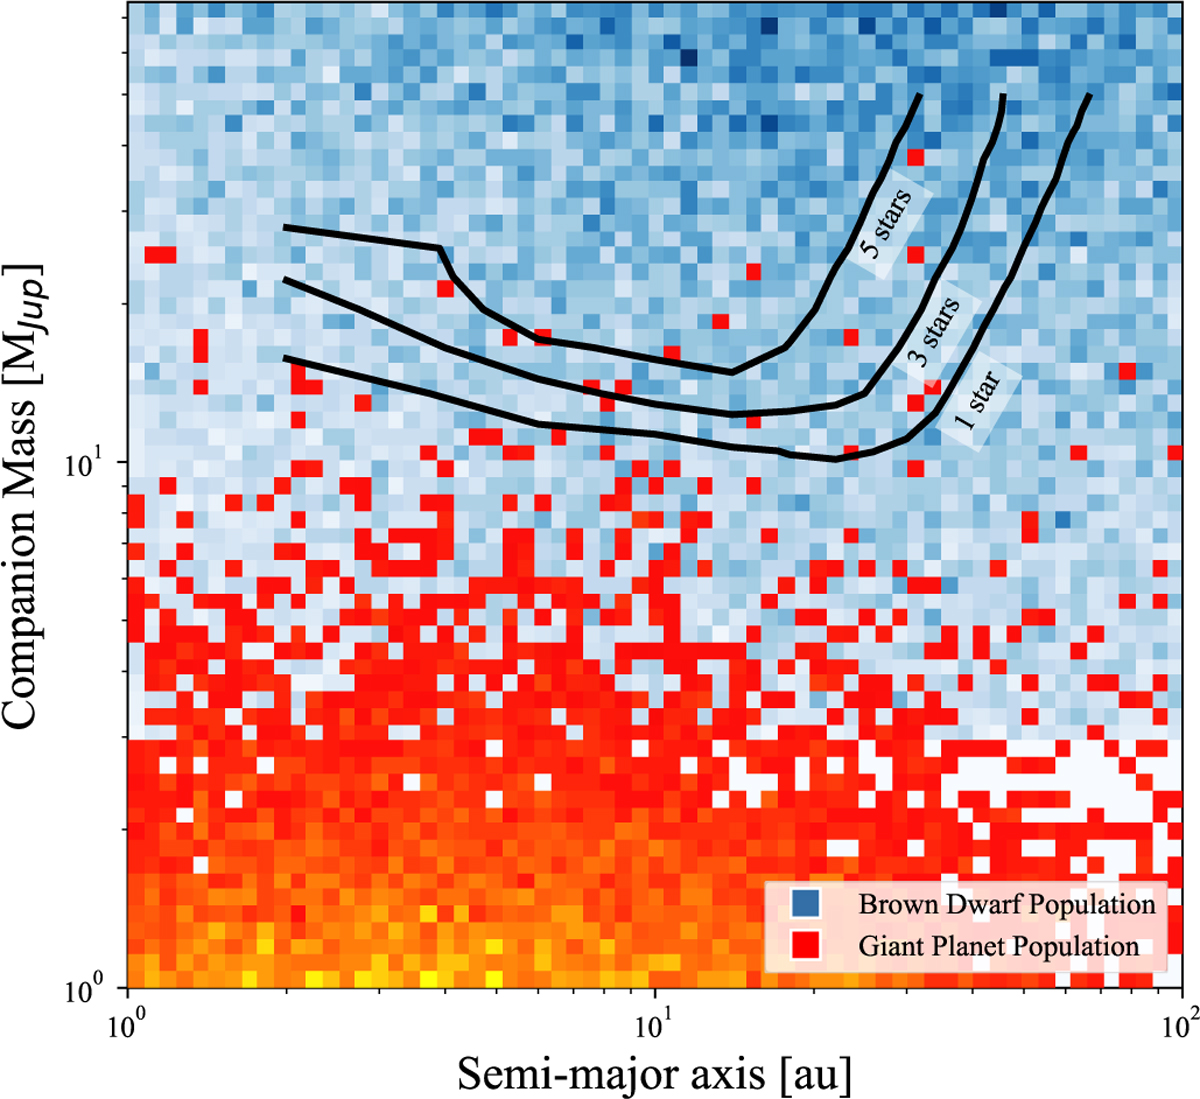
Comparison of the depth of search of the SPHERE H2 survey for the presented 7 M dwarf sample (Fig. 6) with a population of 100’000 draws from our parametric model for companions around M dwarfs. The contour lines give the numbers of stars around which the survey is sensitive to sub-stellar companions as a function of mass and semimajor axis. The brown dwarf population generated from the model is represented with shades of blue (high density) to white (low density), while the giant planet part of the model is represented as a heatmap from red (low density) to yellow (high density of companions).
Current usage metrics show cumulative count of Article Views (full-text article views including HTML views, PDF and ePub downloads, according to the available data) and Abstracts Views on Vision4Press platform.
Data correspond to usage on the plateform after 2015. The current usage metrics is available 48-96 hours after online publication and is updated daily on week days.
Initial download of the metrics may take a while.