Fig. 11.
Download original image
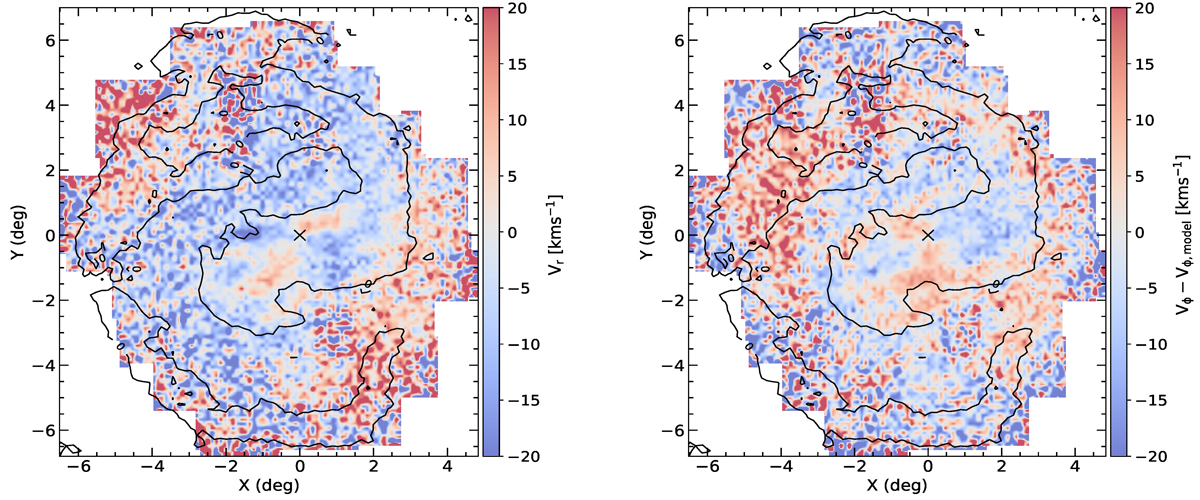
Internal velocity maps in the polar coordinates in the LMC disc plane aligned with the sky plane. Left: The radial velocity map. Right: The residual azimuth velocity map (measured velocity - model velocity). The black contour line highlights the over-density regions, i.e. the bar and spiral arm. The dynamical centre derived in this study is indicated by a black cross. East is to the left and north is to the top.
Current usage metrics show cumulative count of Article Views (full-text article views including HTML views, PDF and ePub downloads, according to the available data) and Abstracts Views on Vision4Press platform.
Data correspond to usage on the plateform after 2015. The current usage metrics is available 48-96 hours after online publication and is updated daily on week days.
Initial download of the metrics may take a while.