Open Access
Fig. 2.
Download original image
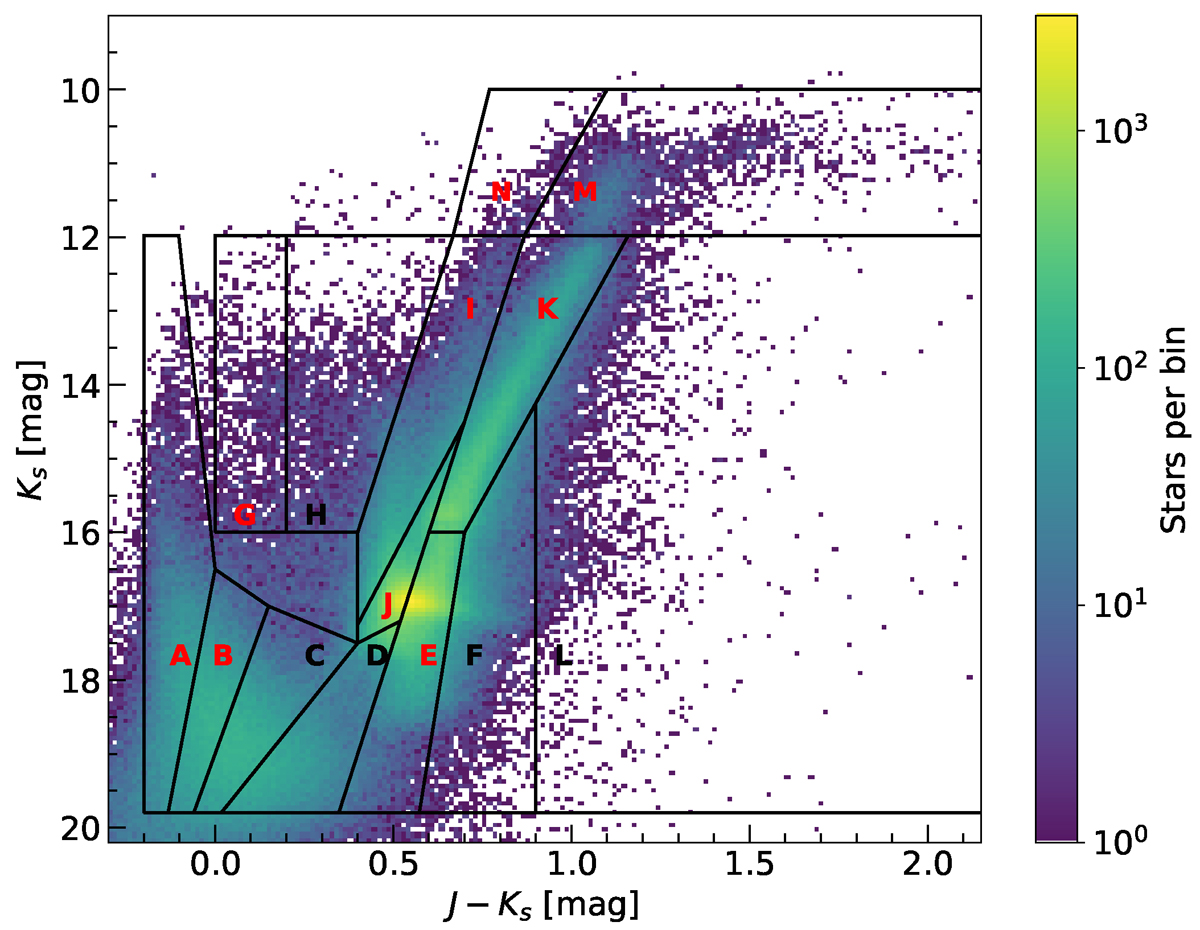
Near-infrared CMD of the Gaia–VMC Deep cross-matched catalogue for the tile LMC 6_5, showcasing probable LMC sources. The distinct stellar regions are depicted with the LMC dominant segments highlighted in red. The background illustrates the stellar density Hess diagram.
Current usage metrics show cumulative count of Article Views (full-text article views including HTML views, PDF and ePub downloads, according to the available data) and Abstracts Views on Vision4Press platform.
Data correspond to usage on the plateform after 2015. The current usage metrics is available 48-96 hours after online publication and is updated daily on week days.
Initial download of the metrics may take a while.