Fig. 5.
Download original image
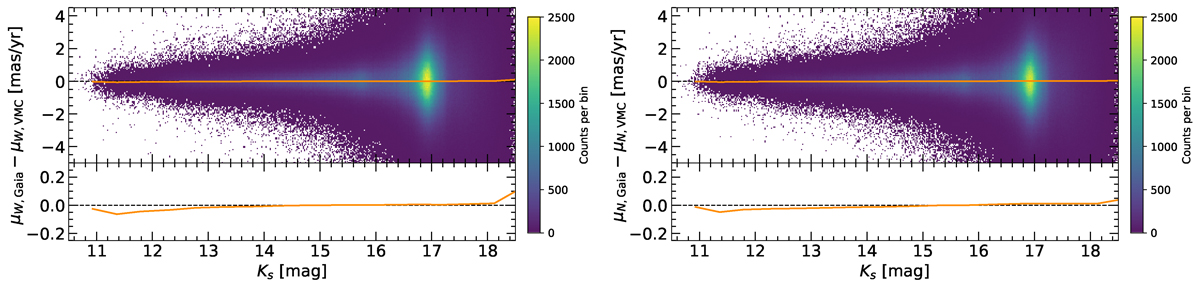
Difference between absolute proper motion measurements for common sources in VMC and Gaia datasets, shown separately for μW (left) and μN (right) directions, as a function of Ks magnitude. The orange horizontal lines represent the median difference in 0.5 mag bins. The lower panels provide a zoomed-in view of the median differences to highlight any subtle trends.
Current usage metrics show cumulative count of Article Views (full-text article views including HTML views, PDF and ePub downloads, according to the available data) and Abstracts Views on Vision4Press platform.
Data correspond to usage on the plateform after 2015. The current usage metrics is available 48-96 hours after online publication and is updated daily on week days.
Initial download of the metrics may take a while.