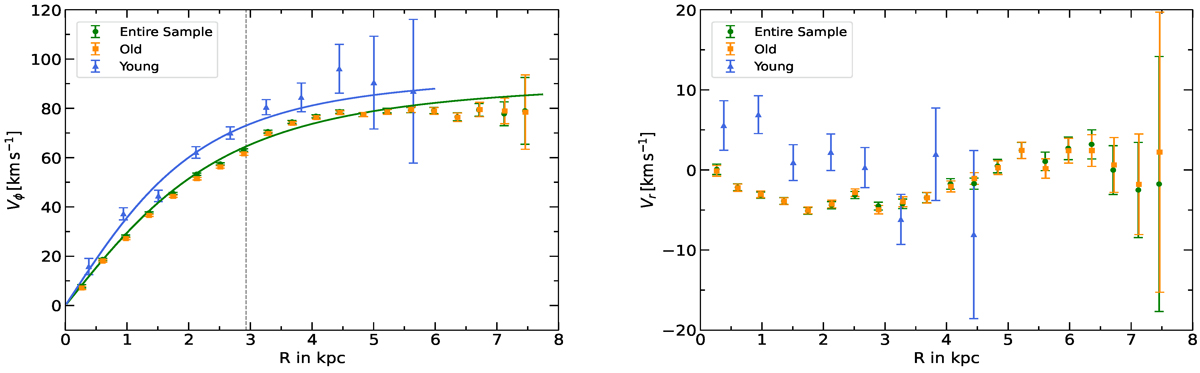
Fig. 7.
Download original image
Rotation (left) and radial velocity curves (right) of the LMC for different stellar populations. In the rotation curve (left), the vertical dashed line indicates the estimated R0 value for the entire sample from the MCMC sampling. The green and blue solid lines represent the theoretical rotation curve for the whole sample and the young population, respectively.
Current usage metrics show cumulative count of Article Views (full-text article views including HTML views, PDF and ePub downloads, according to the available data) and Abstracts Views on Vision4Press platform.
Data correspond to usage on the plateform after 2015. The current usage metrics is available 48-96 hours after online publication and is updated daily on week days.
Initial download of the metrics may take a while.