Open Access
Fig. 9.
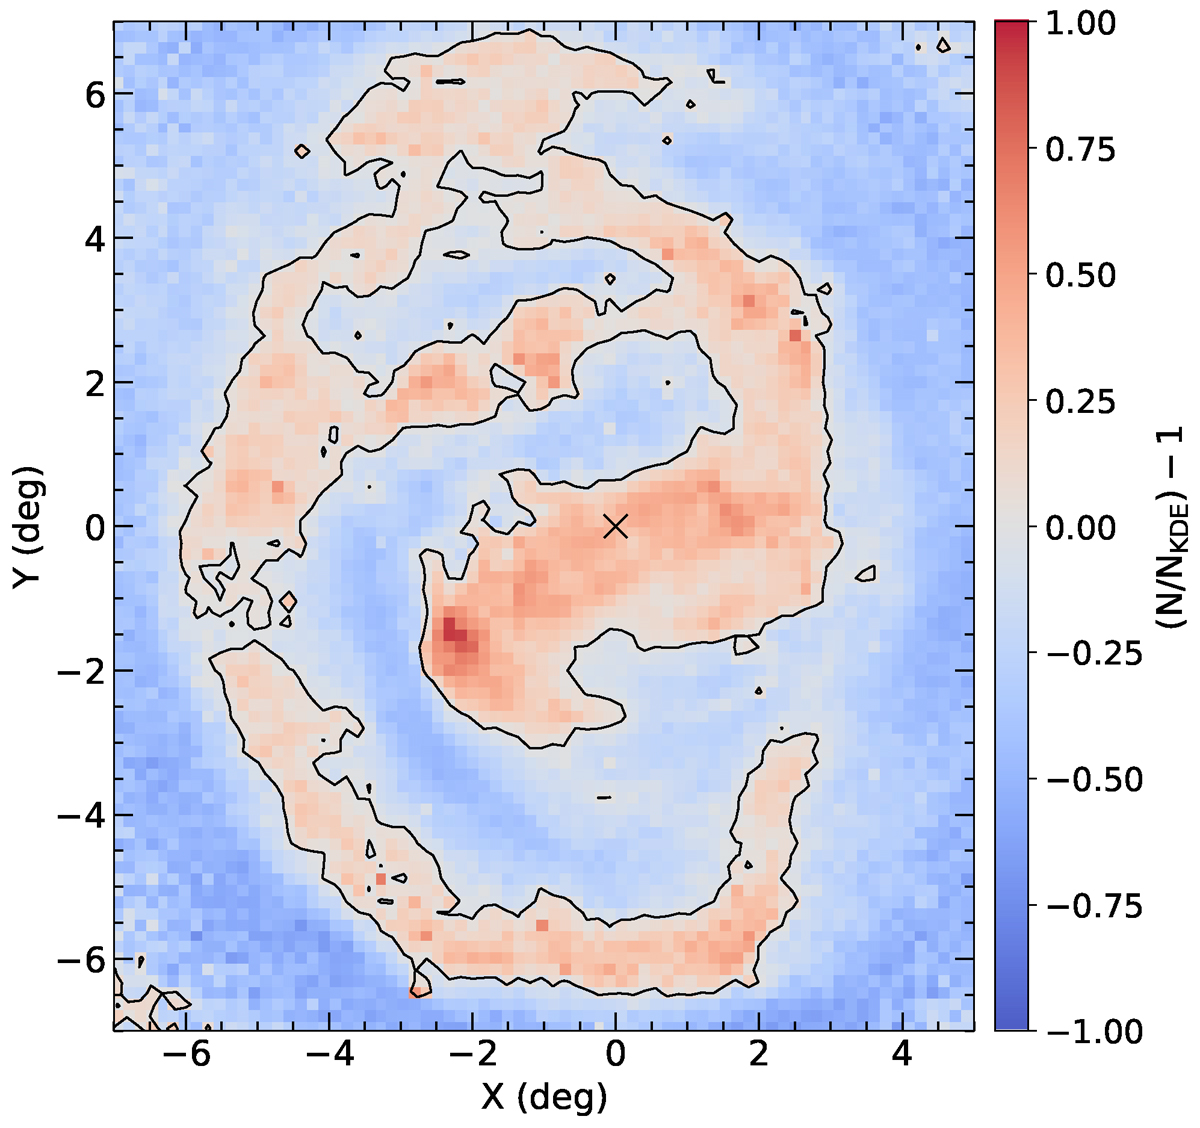
Download original image
Density contour plot highlighting the off-centre bar and the spiral arm of the LMC projected in the disc plane and aligned with the sky plane. The contour was created using likely LMC sources in the Gaia eDR3 dataset with a KDE bandwidth of 0.4 deg. The dynamical centre derived in this study is indicated by a black cross.
Current usage metrics show cumulative count of Article Views (full-text article views including HTML views, PDF and ePub downloads, according to the available data) and Abstracts Views on Vision4Press platform.
Data correspond to usage on the plateform after 2015. The current usage metrics is available 48-96 hours after online publication and is updated daily on week days.
Initial download of the metrics may take a while.