Fig. 3.
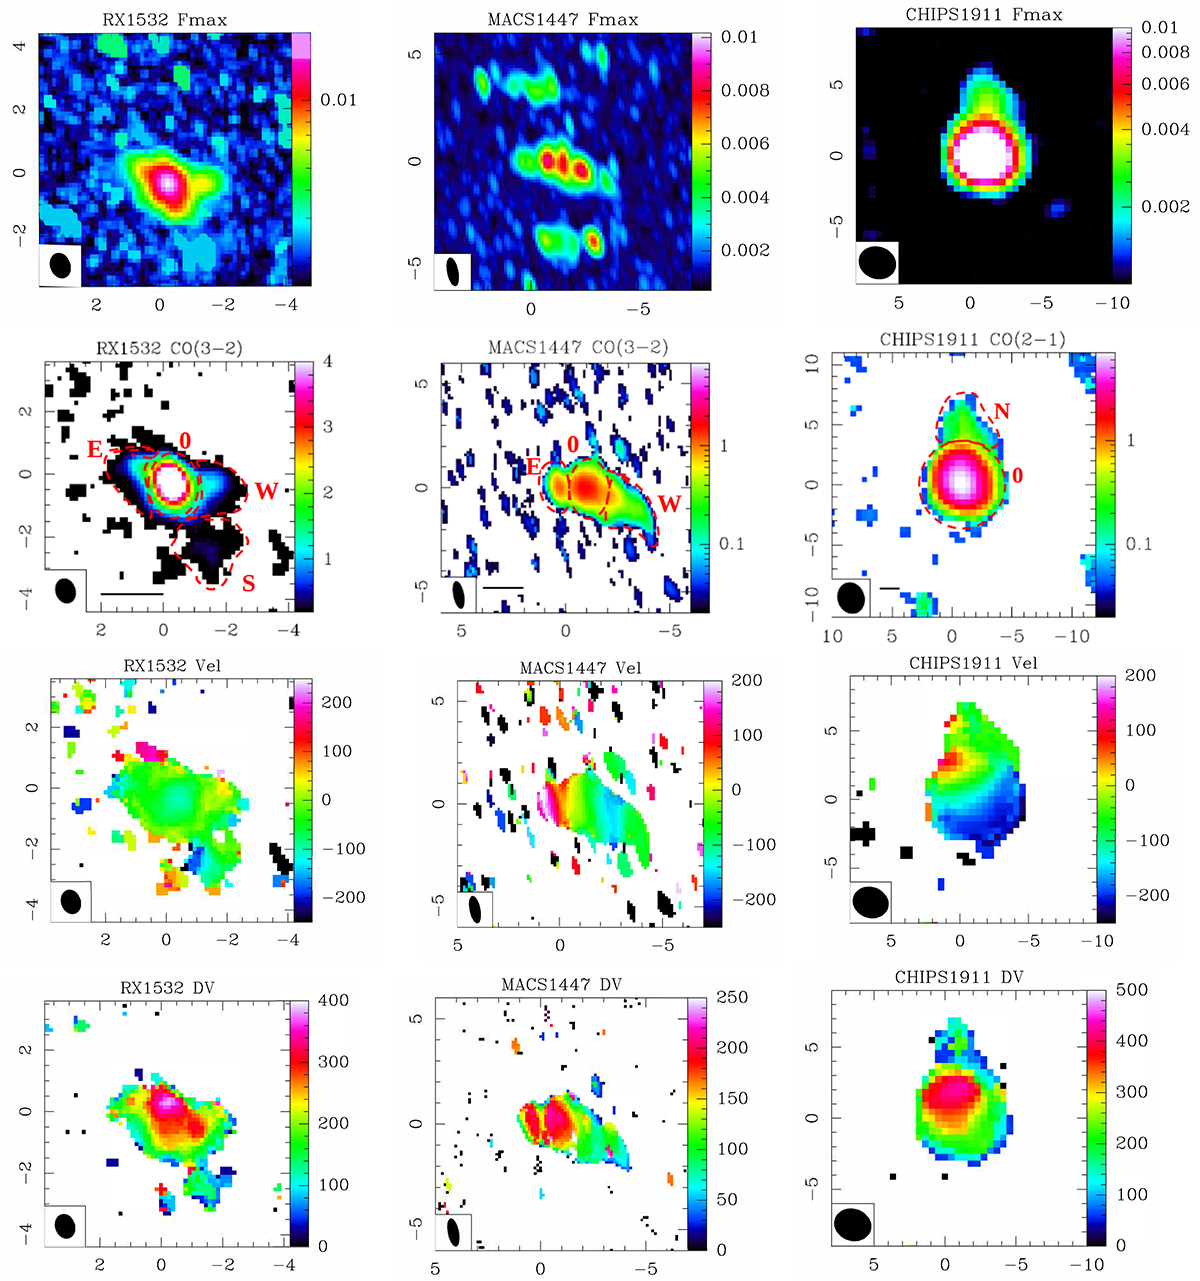
Download original image
From left to right: NOEMA maps of RX 1532 (left), MACS 1447 (center), and CHIPS 1911 (right). From top to bottom: Maps of maxima, evaluated at each pixel of each map; moment-0 maps; moment-1 maps; and moment-2 maps. Coordinates are reported as separation from the phase centers of the observations, as reported in Table 1. In each panel the NOEMA beam size is reported at bottom left, while the velocity range used for the integration is between –500 and +500 km s−1 for each map. In each of the moment-0 maps, the solid black line at the bottom left denotes a scale of 10 kpc at the BCG redshift. Sub-regions denoted with the labels 0, N, S, W, and E, which were used to extract spectra, are defined by the red dashed lines in the moment-0 maps. We refer to the text for further details. From top to bottom: Values in the color bars correspond to units of Jy⋅beam−1 (maps of maxima), Jy⋅km s−1 (moment-0 maps), and km s−1 (moment-1 and moment-2 maps), where velocities are evaluated with respect to the BCG redshifts, as reported in Table 1.
Current usage metrics show cumulative count of Article Views (full-text article views including HTML views, PDF and ePub downloads, according to the available data) and Abstracts Views on Vision4Press platform.
Data correspond to usage on the plateform after 2015. The current usage metrics is available 48-96 hours after online publication and is updated daily on week days.
Initial download of the metrics may take a while.