Fig. 4.
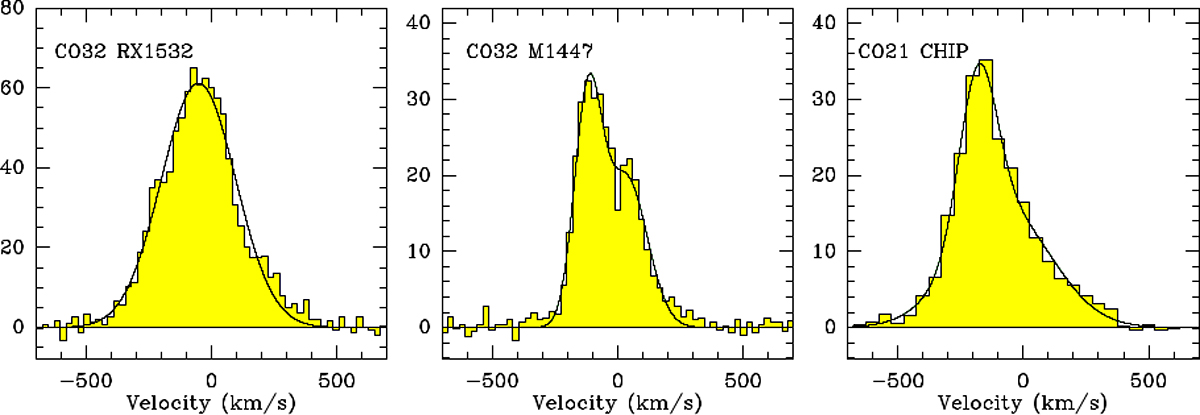
Download original image
Spectra of RX 1532, MACS 1447, and CHIPS 1911 BCGs obtained with NOEMA. For each BCG, we considered the total emission component (see Table 2). The solid lines show the continuum-subtracted best fits to the CO emission, where two Gaussian curves are used for MACS 1447 and CHIPS 1911, and one Gaussian only for RX 1532. The flux (y-axis) in units of mJy, is plotted against the relative velocity with respect to the BCG redshift, as in Table 1.
Current usage metrics show cumulative count of Article Views (full-text article views including HTML views, PDF and ePub downloads, according to the available data) and Abstracts Views on Vision4Press platform.
Data correspond to usage on the plateform after 2015. The current usage metrics is available 48-96 hours after online publication and is updated daily on week days.
Initial download of the metrics may take a while.