Fig. 6.
Download original image
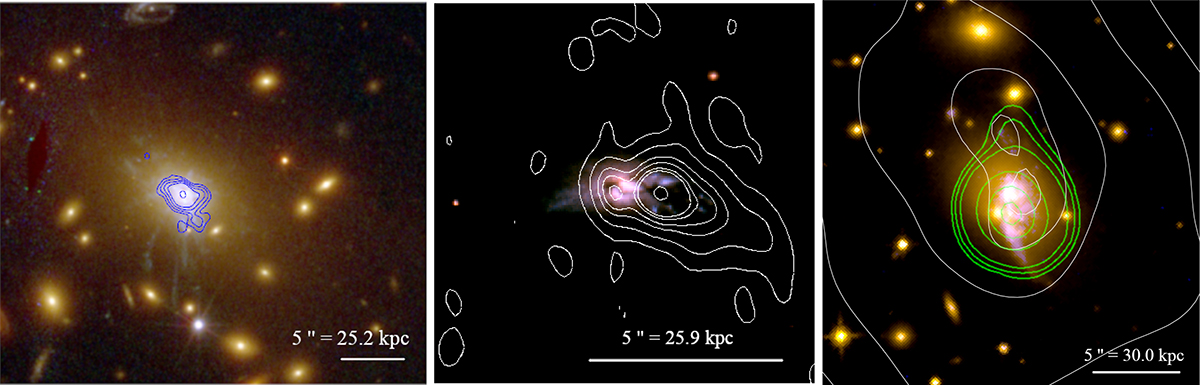
From left to right: Color-composite images of RX 1532 (left), MACS 1447 (center), and CHIPS 1911 (right). The RGB image of RX 1532 is taken from Fogarty et al. (2015) and made using HST WFC3-IR filters F105W + F110W + F125W + F140W + F160W in red, the ACS filters F606W + F625W + F775W + F814W + F850LP in green, and the ACS filters F435W + F475W in blue. The RGB image of MACS 1447 is from Prasow-Émond et al. (2020), and made using the HST WFC filters F814W (red and blue channels) and F606W (green). For CHIPS 1911, the color-composite image is taken from Somboonpanyakul et al. (2021a) and made using F550M data from the ACS and F110W data from the WFC infrared channel (WFC3-IR). CO contours from NOEMA observations reported in this work are superimposed with blue (left), white (center), and green (right) solid lines, respectively. For all three BCGs, contour levels start at S/N = 3, where the rms noise levels, estimated directly from the CO intensity maps, are equal to 20, 8, and 36 mJy beam−1 km s−1 for RX 1532, MACS 1447, and CHIPS 1911, respectively. Namely, contour levels correspond to (0.06, 0.2, 0.5, 1.0, 5.0) Jy beam−1 km s−1 in CO(3→2) for RX 1532; (0.024, 0.2, 0.5, 0.7, 0.9, 1.0, 1.5) Jy beam−1 km s−1 in CO(3→2) for MACS 1447; and (0.108, 0.2, 0.4, 1.9, 3.7, 5.5) Jy beam−1 km s−1 in CO(2→1) for CHIPS 1911. For CHIPS 1911, white contours refer to the Chandra 0.5–7.0 keV emission and are from Somboonpanyakul et al. (2021a). North is up, east is to the left.
Current usage metrics show cumulative count of Article Views (full-text article views including HTML views, PDF and ePub downloads, according to the available data) and Abstracts Views on Vision4Press platform.
Data correspond to usage on the plateform after 2015. The current usage metrics is available 48-96 hours after online publication and is updated daily on week days.
Initial download of the metrics may take a while.