Fig. 7.
Download original image
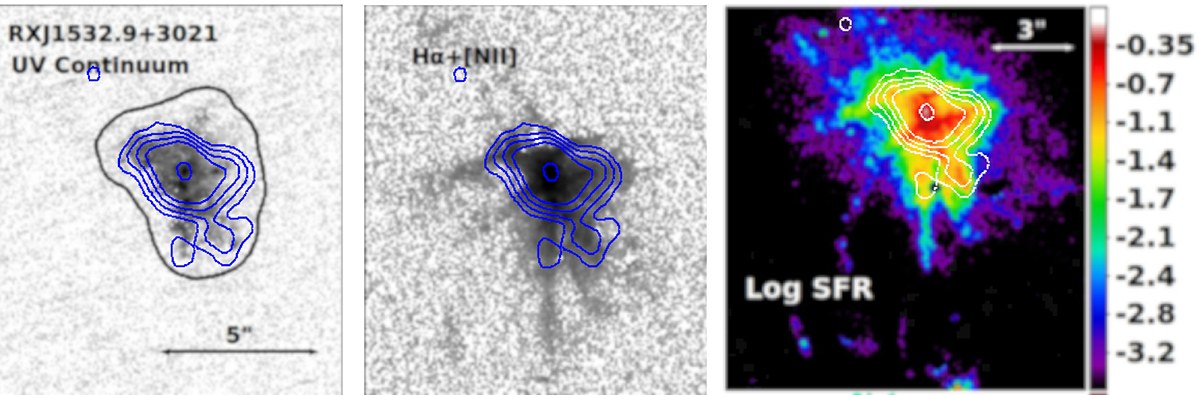
Maps of RX 1532 BCG. Left: Ultraviolet continuum map. The solid curve denotes the region used to estimate the UV luminosity by Fogarty et al. (2015). Center: Hα+[NII] by Fogarty et al. (2015). Right: Star formation rate map reconstructed by Fogarty et al. (2015). The color bar is in logarithmic units of log[SFR/(M⊙yr−1)]. Blue (left and center panels) and white contours (right panel) correspond to the CO(3→2) contour levels from NOEMA, as reported in Fig. 6. North is up, east is to the left.
Current usage metrics show cumulative count of Article Views (full-text article views including HTML views, PDF and ePub downloads, according to the available data) and Abstracts Views on Vision4Press platform.
Data correspond to usage on the plateform after 2015. The current usage metrics is available 48-96 hours after online publication and is updated daily on week days.
Initial download of the metrics may take a while.