Fig. 1
Download original image
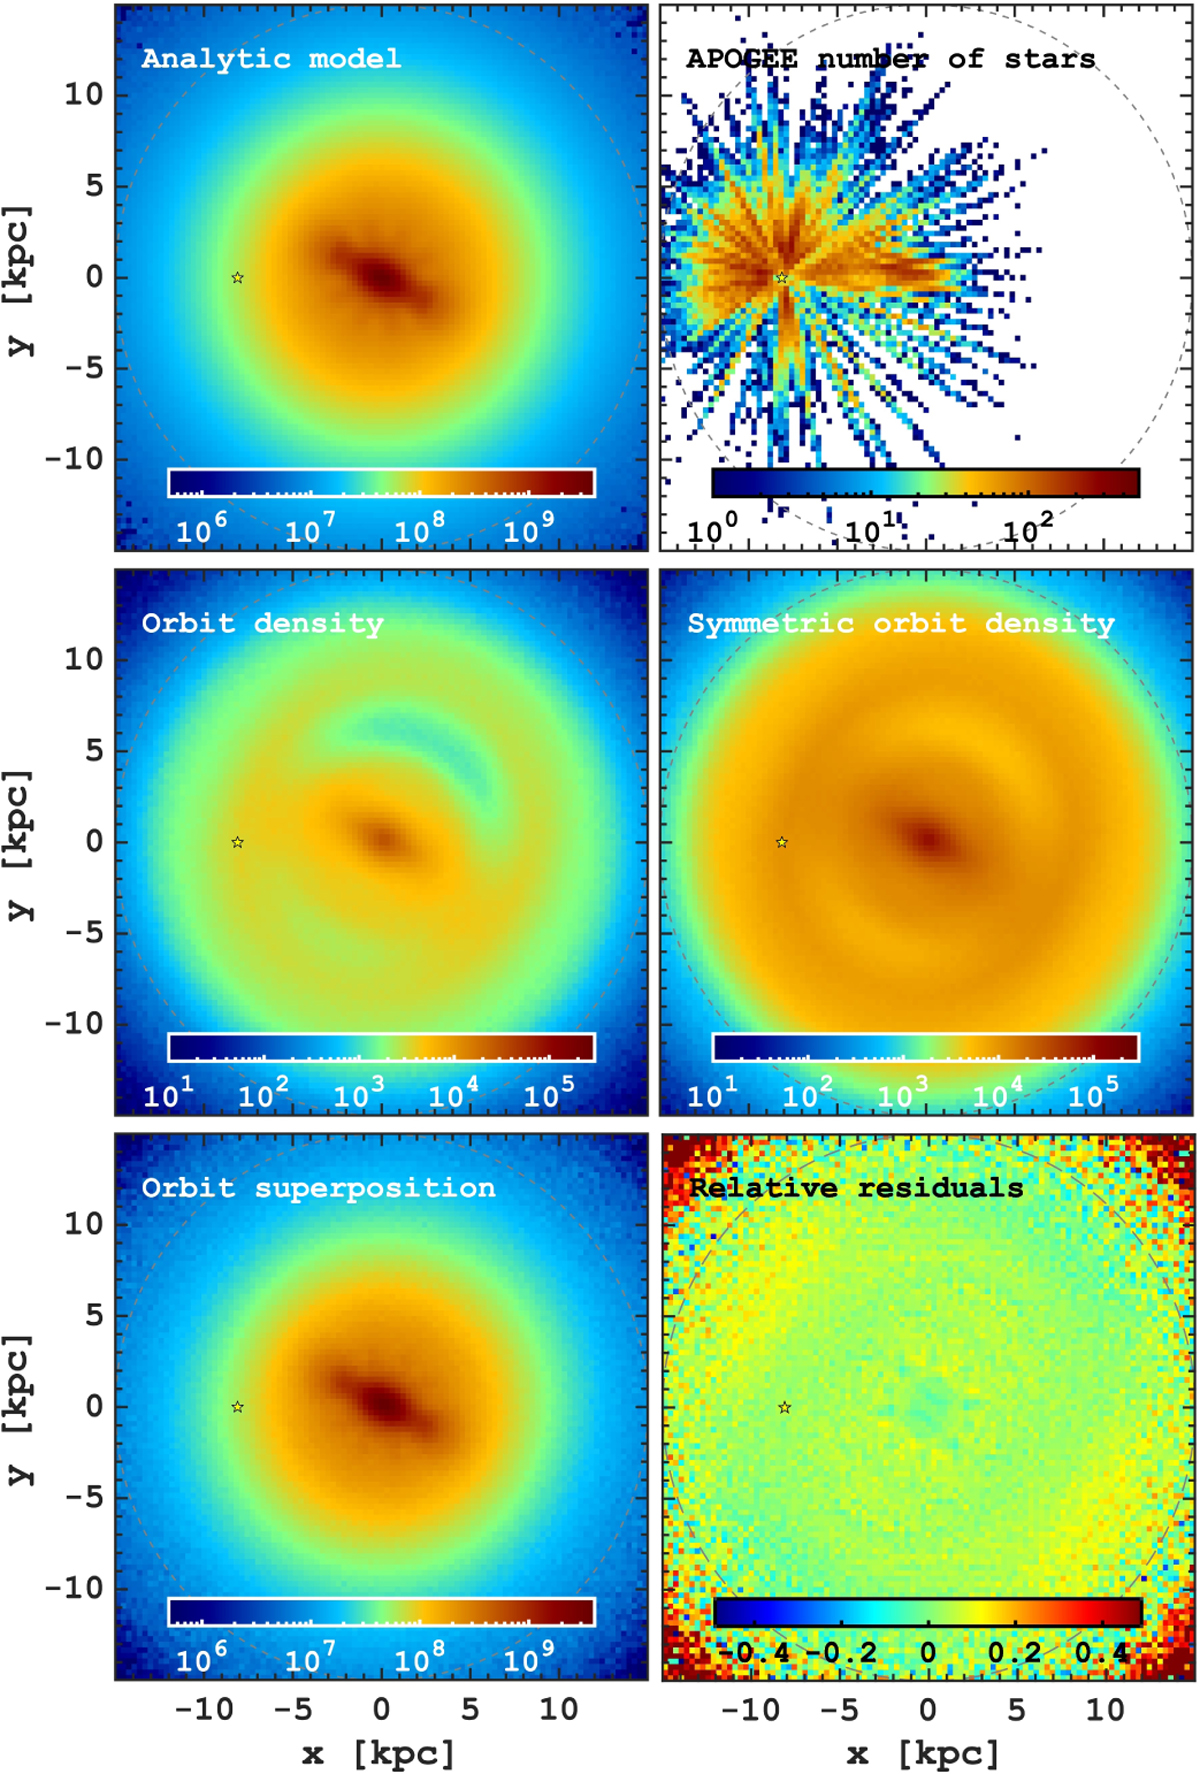
Recovery of the MW density structure using orbit superposition and APOGEE dataset. The top-left panel shows the projected MW stellar density from the analytic model (Sormani et al. 2022). The top-right panel shows the face-on distribution of stars in the APOGEE sample (see Section 2.1). The second row shows the raw density of orbits of the APOGEE stars before mirroring (left) and after (right). The bottom row shows the result of the orbit superposition, which is the weighted density of the orbits after mirroring (left) and the difference (right) between the top left and reconstructed density. The grey dashed circle corresponds to 15 kpc inside of which the orbit superposition solution was obtained. The yellow asterisk marks the position of the Sun.
Current usage metrics show cumulative count of Article Views (full-text article views including HTML views, PDF and ePub downloads, according to the available data) and Abstracts Views on Vision4Press platform.
Data correspond to usage on the plateform after 2015. The current usage metrics is available 48-96 hours after online publication and is updated daily on week days.
Initial download of the metrics may take a while.