Fig. 10
Download original image
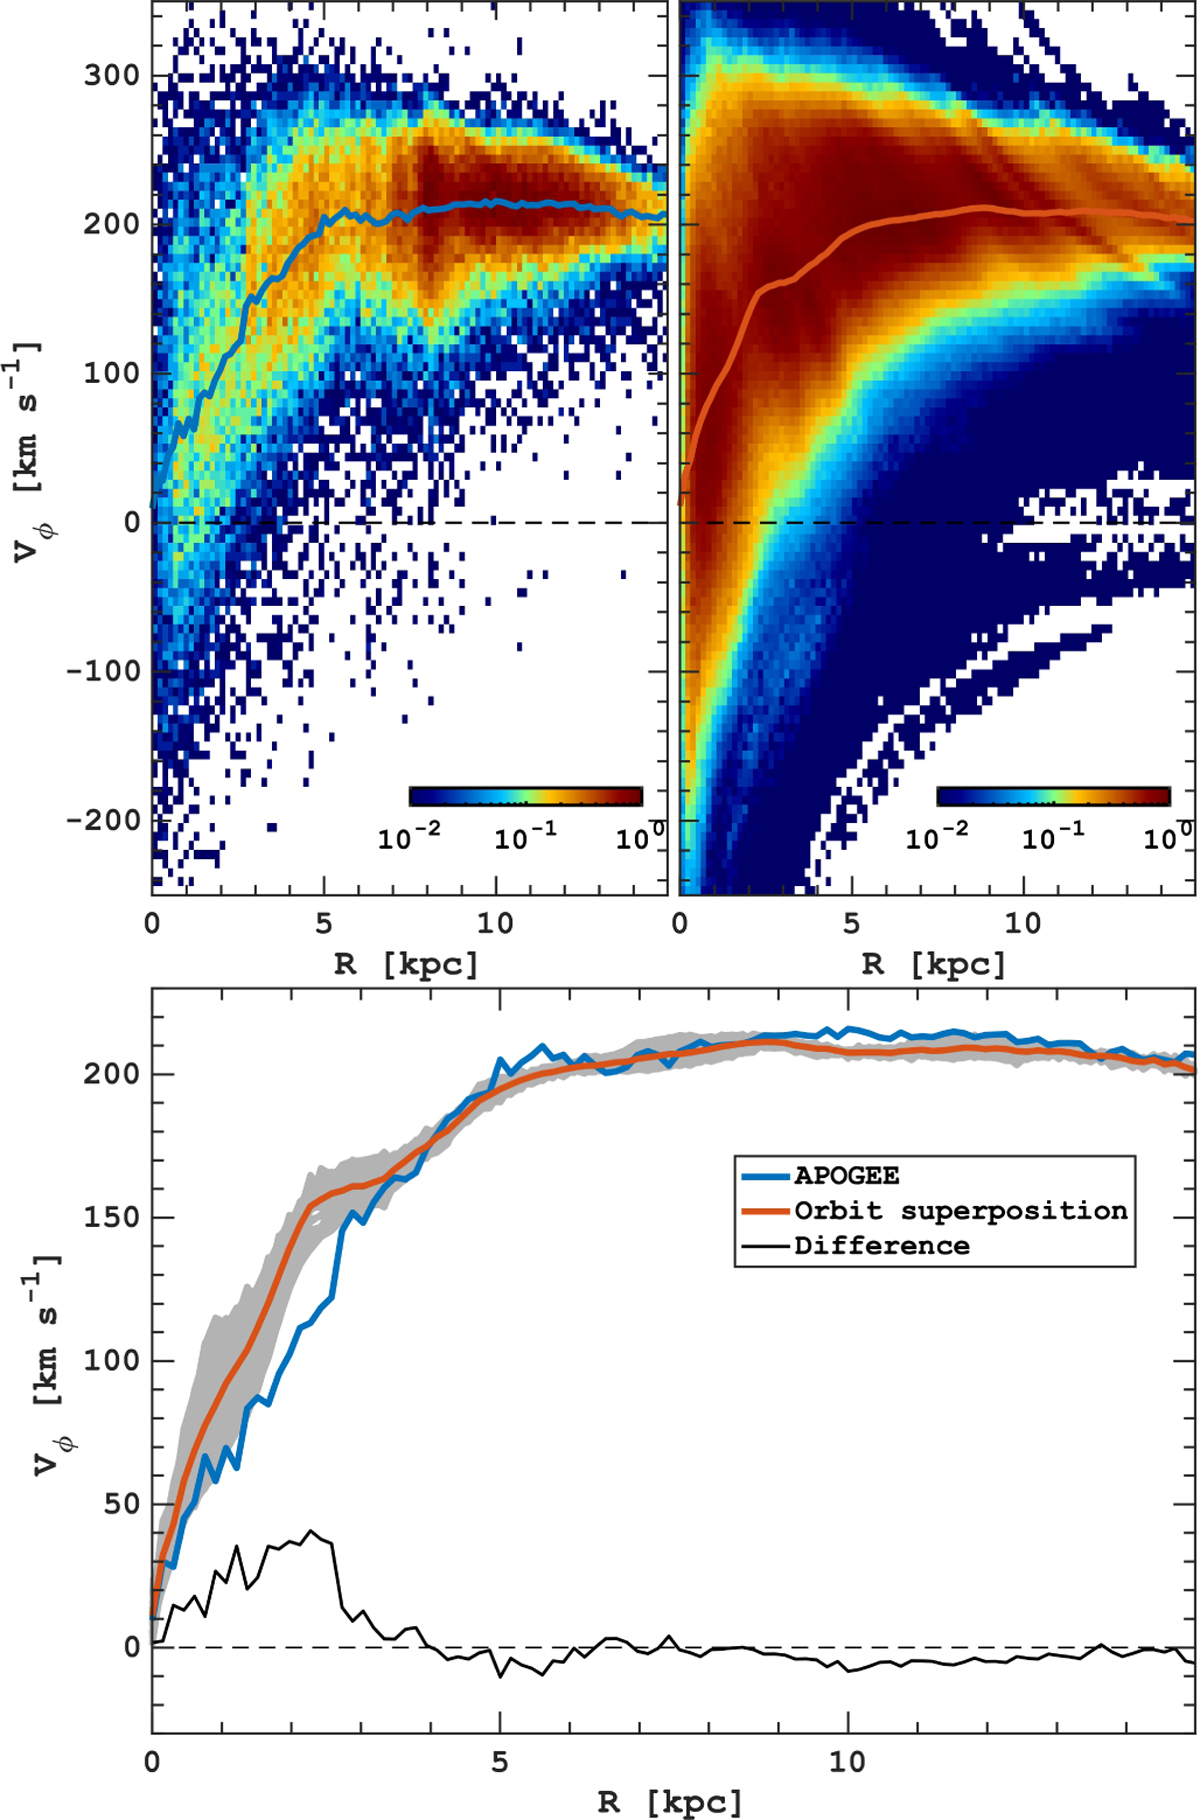
Azimuthal velocity (Vϕ) distribution as a function of Galactocentric distance based on the APOGEE sample (left) and the mass-weighted distribution orbit superposition (right). The mean trends in each panel are shown by the blue and red lines, respectively. Their comparison is shown in the bottom panel, where the solid black line represents the difference. The variation of the mean rotational velocity with azimuth in the orbit superposition reconstruction output is marked by the grey colour.
Current usage metrics show cumulative count of Article Views (full-text article views including HTML views, PDF and ePub downloads, according to the available data) and Abstracts Views on Vision4Press platform.
Data correspond to usage on the plateform after 2015. The current usage metrics is available 48-96 hours after online publication and is updated daily on week days.
Initial download of the metrics may take a while.