Fig. 15
Download original image
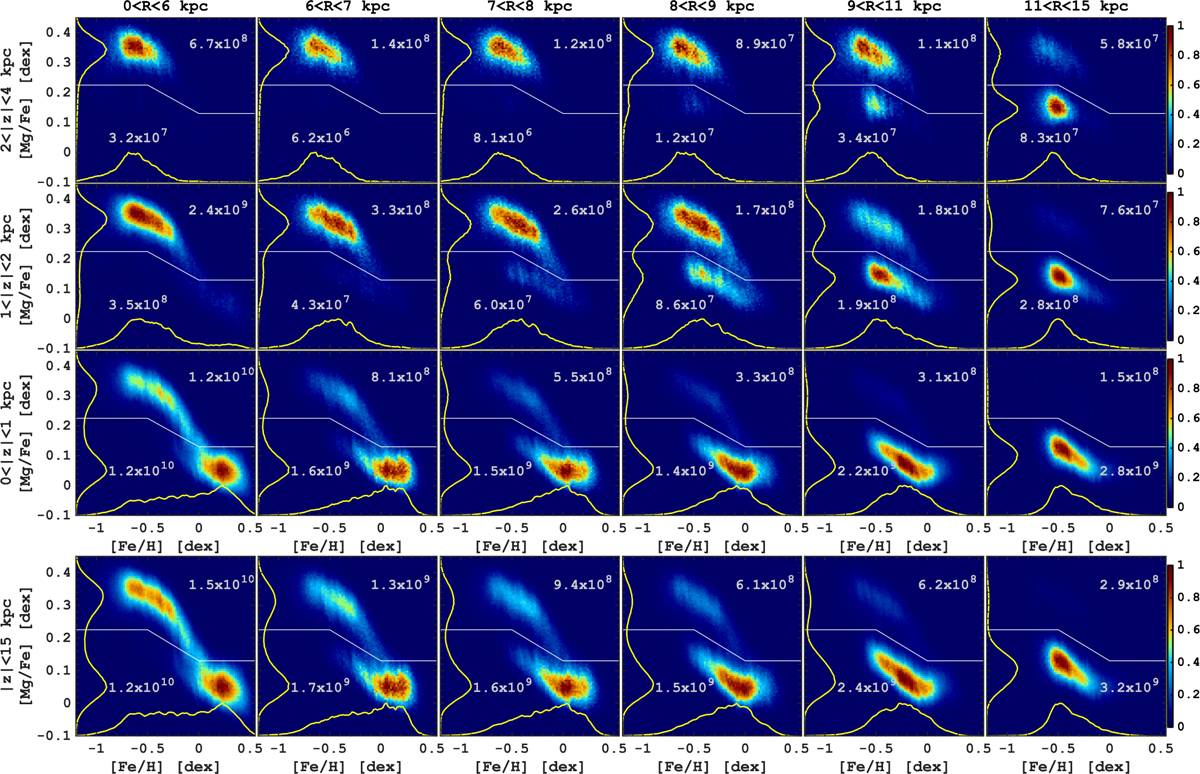
Distribution of stellar mass in the [Mg/Fe] vs. [Fe/H] plane as a function of Galactocentric distance, R, and lzl. The bottom set of panels corresponds to the radial selection only, within 15 kpc from the mid-plane. In each panel, the yellow lines show the normalized [Mg/Fe]- and [Fe/H]-distribution functions, and the white line shows a boundary used to separate high- and low-α populations. The masses of high- and low-α populations in a given radial and vertical bin are marked with the grey numbers in M⊙ units.
Current usage metrics show cumulative count of Article Views (full-text article views including HTML views, PDF and ePub downloads, according to the available data) and Abstracts Views on Vision4Press platform.
Data correspond to usage on the plateform after 2015. The current usage metrics is available 48-96 hours after online publication and is updated daily on week days.
Initial download of the metrics may take a while.