Fig. 17
Download original image
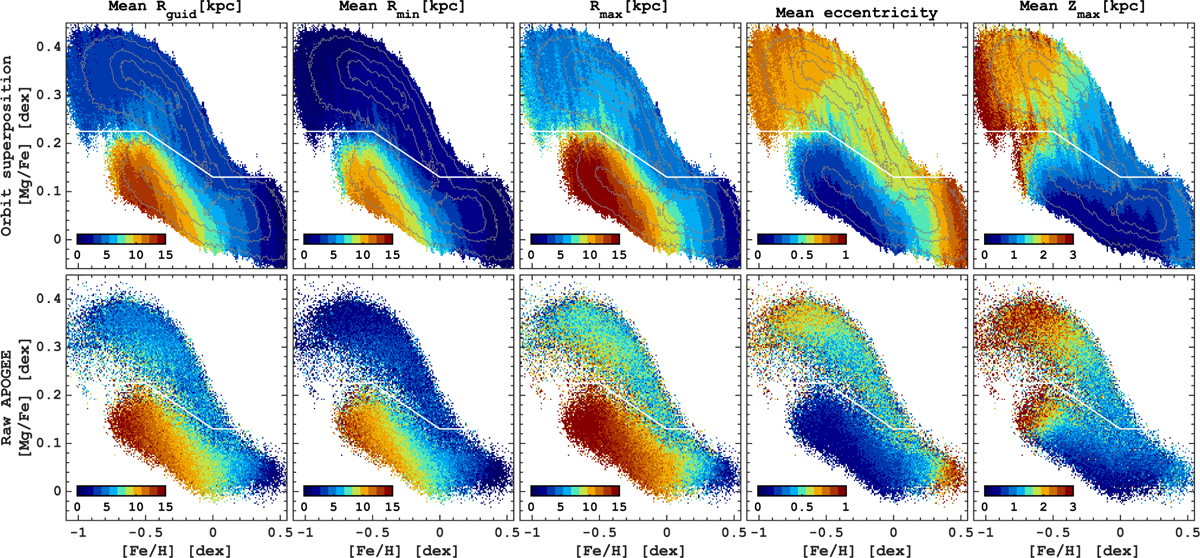
Mean orbital parameters values in the [Mg/Fe] − [Fe/H] plane for the entire MW disc. From left to right: guiding radius (Rguid), pericentre (Rmin), apocentre (Rmax), eccentricity and maximum vertical excursion (Zmax). The grey lines show the isodensity contours. The white lines correspond to the boundary used to define high- and low-α populations. The top row shows the result of the orbit superposition solution, while the bottom one shows the raw APOGEE data.
Current usage metrics show cumulative count of Article Views (full-text article views including HTML views, PDF and ePub downloads, according to the available data) and Abstracts Views on Vision4Press platform.
Data correspond to usage on the plateform after 2015. The current usage metrics is available 48-96 hours after online publication and is updated daily on week days.
Initial download of the metrics may take a while.