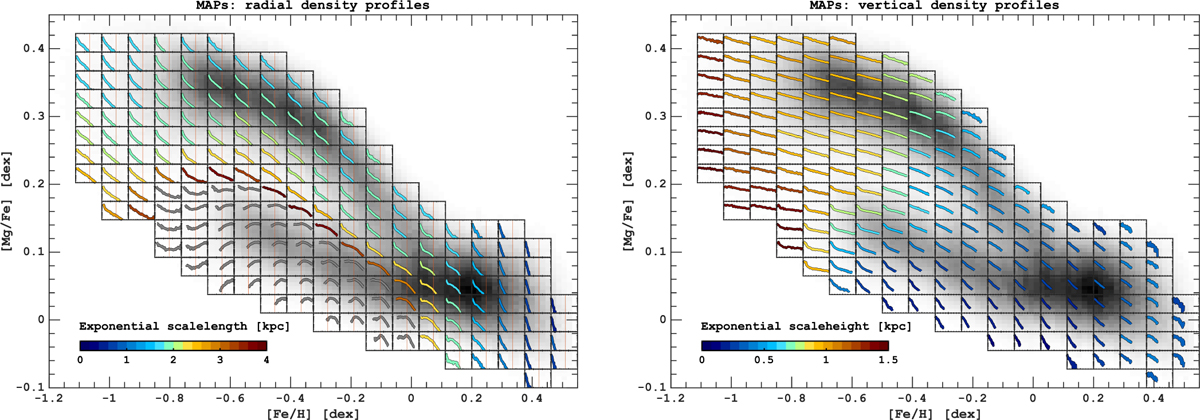
Fig. 18
Download original image
Radial and vertical structure of MAPs. The background map shows the stellar mass in the [Mg/Fe] vs. [Fe/H] plane. Each subpanel shows the radial (left) and vertical (right) density profiles of MAPs selected in the abundance range from the background map. The colour of lines in the subpanels corresponds to the exponential scalelengths (left) and scaleheights (right) according to the colour bar. In the left subpanels, the low metallicity part of the low-α sequence does not show exponential profiles but rather a donut-like distribution, where the exponential fit fails to recover meaningful values of the scalelength. On the left, the location of the solar radius is marked by the red vertical lines.
Current usage metrics show cumulative count of Article Views (full-text article views including HTML views, PDF and ePub downloads, according to the available data) and Abstracts Views on Vision4Press platform.
Data correspond to usage on the plateform after 2015. The current usage metrics is available 48-96 hours after online publication and is updated daily on week days.
Initial download of the metrics may take a while.