Fig. 25
Download original image
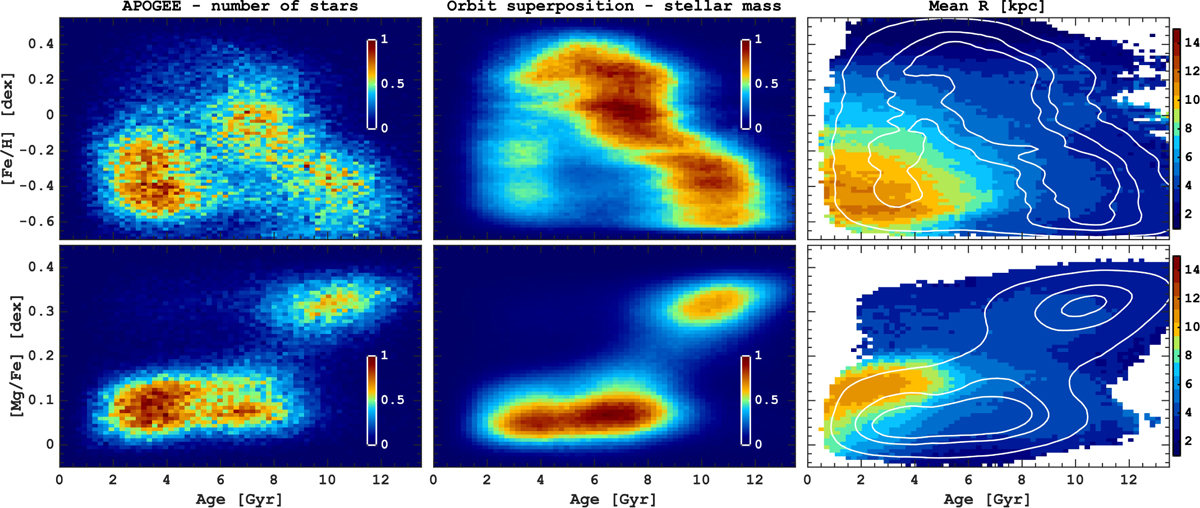
Age–[Fe/H] (top) and age–[Mg/Fe] (bottom) relations. The left column shows the raw APOGEE number of stars, while the middle column shows the stellar mass distribution from orbit superposition. The rightmost column shows the orbit superposition results colour-codded by the mean value of the guiding radius, where the white contours mark the density distribution in the corresponding coordinates.
Current usage metrics show cumulative count of Article Views (full-text article views including HTML views, PDF and ePub downloads, according to the available data) and Abstracts Views on Vision4Press platform.
Data correspond to usage on the plateform after 2015. The current usage metrics is available 48-96 hours after online publication and is updated daily on week days.
Initial download of the metrics may take a while.