Fig. 26
Download original image
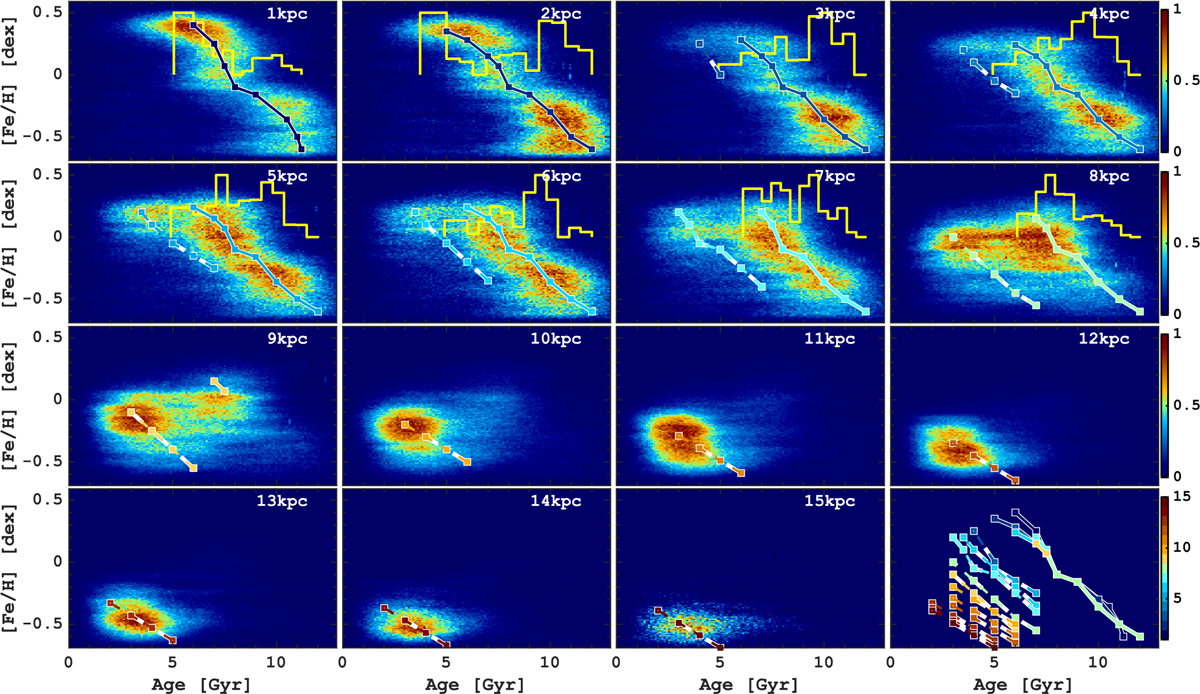
Stellar mass distribution in the age–[Fe/H] plane. Each panel shows the normalised distribution for stars inside 1 kpc-width guiding radii rings, as marked in the top right corner. The colour lines in each panel trace the time-dependence of abundance variation with stellar age obtained by optimisation of age–[Fe/H] (this figure), age–[Mg/Fe] (Fig. 27) and [Fe/H] − [Mg/Fe] distributions (Fig. 28). The rightmost bottom panel shows all the parametric curves for different guiding radii according to the colour bar. The yellow histograms show the normalised mass distribution along the age–[Fe/H] curves for the old AMR sequence.
Current usage metrics show cumulative count of Article Views (full-text article views including HTML views, PDF and ePub downloads, according to the available data) and Abstracts Views on Vision4Press platform.
Data correspond to usage on the plateform after 2015. The current usage metrics is available 48-96 hours after online publication and is updated daily on week days.
Initial download of the metrics may take a while.