Fig. 3
Download original image
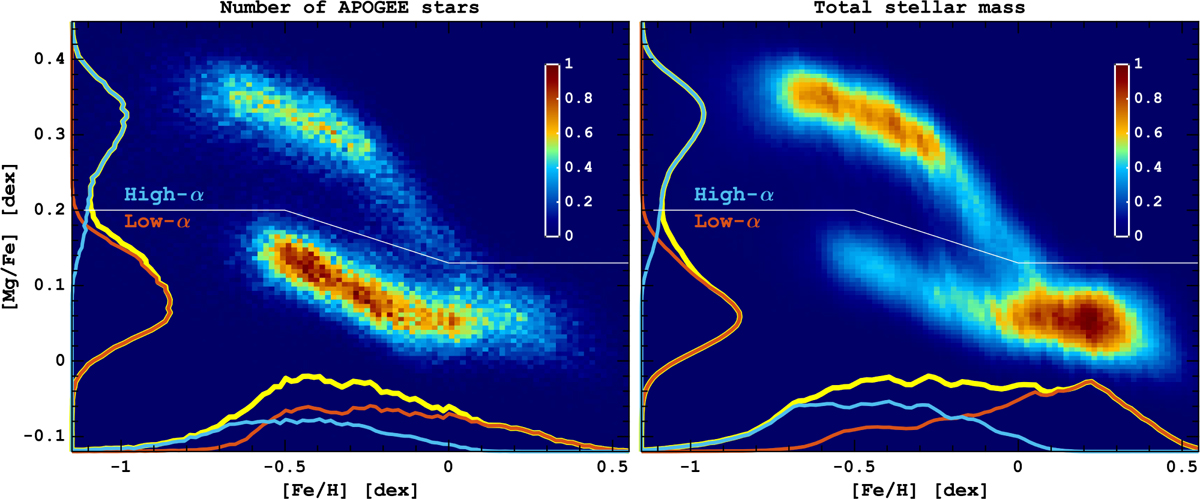
Chemical abundance structure of the MW disc in the [Mg/Fe] − [Fe/H] plane. Left panel shows the number of stars with abundances available in our APOGEE selection, while the right panel depicts the stellar mass-weighted distribution obtained using the orbit superposition method. In both panels, the maps are normalised by the maximum value. The yellow lines show the distributions of [Mg/Fe] and [Fe/H] separately, where the contribution from high- and low-α populations is marked by blue and red, respectively. The solid white line is used to separate high- and low-α populations.
Current usage metrics show cumulative count of Article Views (full-text article views including HTML views, PDF and ePub downloads, according to the available data) and Abstracts Views on Vision4Press platform.
Data correspond to usage on the plateform after 2015. The current usage metrics is available 48-96 hours after online publication and is updated daily on week days.
Initial download of the metrics may take a while.