Fig. 30
Download original image
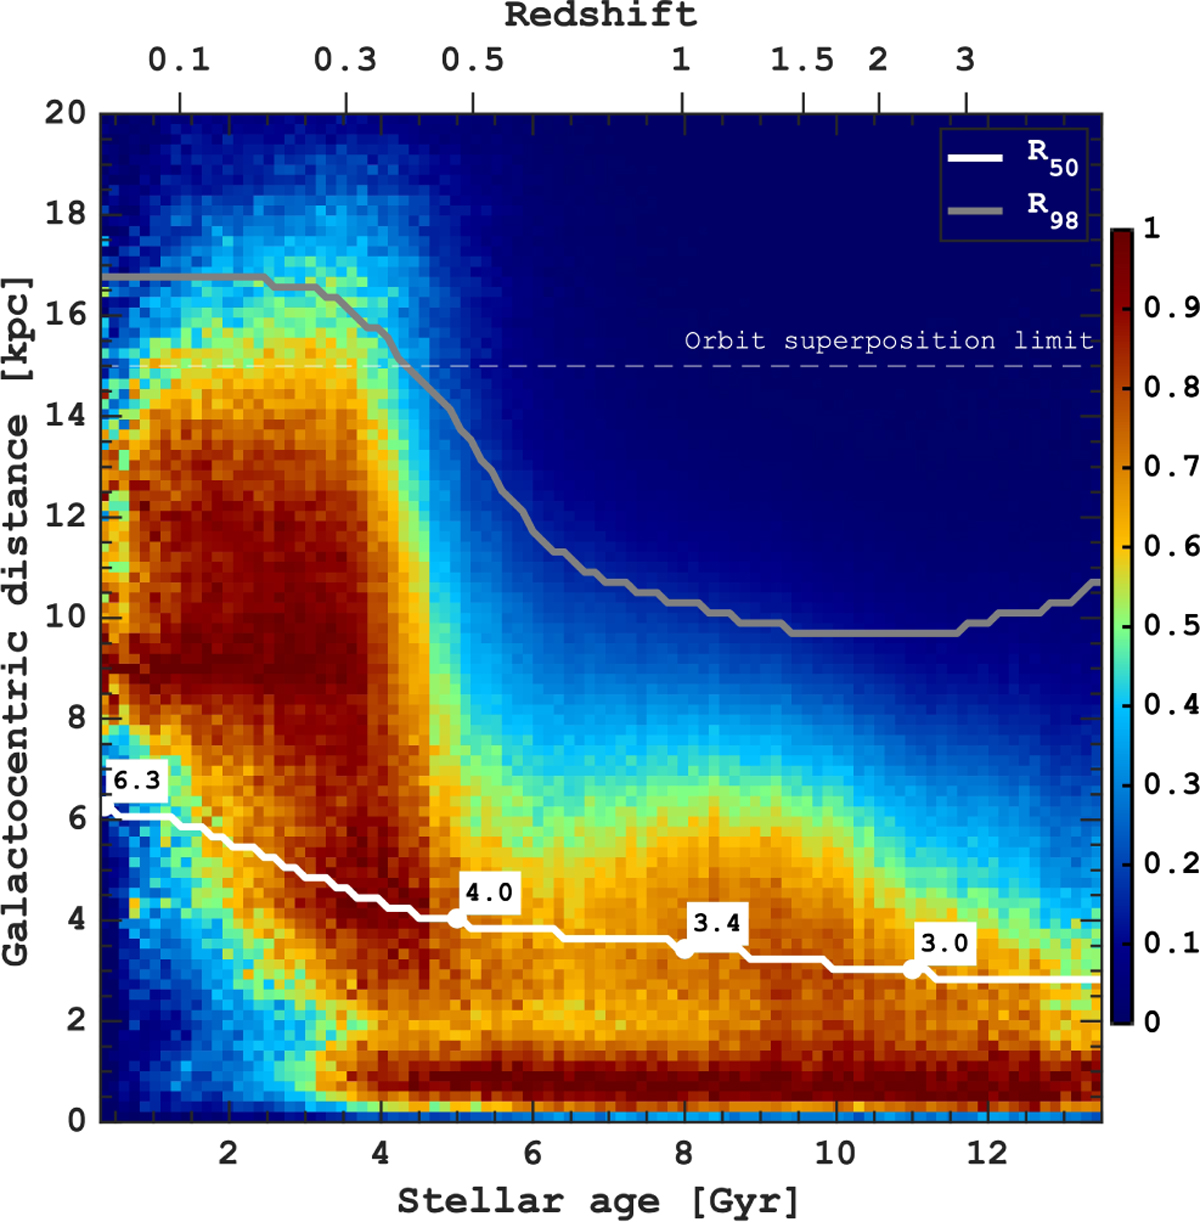
Radial distribution of stellar mass for mono-age populations. For each age bin, the distributions are normalised by the maximum value. The white line shows the effective radius evolution, assuming that the radial mass distribution does not change with time for mono-age populations. Several values of the effective radius at different ages are given along the while line. The grey line shows the radius of 98% of the enclosed mass, R98. We note that R98 can be underestimated for ages earlier than ≈6 Gyr, as our orbit superposition model is designed to fit the stellar density within 15 kpc. Hence, it can be considered the lower limit in this age range.
Current usage metrics show cumulative count of Article Views (full-text article views including HTML views, PDF and ePub downloads, according to the available data) and Abstracts Views on Vision4Press platform.
Data correspond to usage on the plateform after 2015. The current usage metrics is available 48-96 hours after online publication and is updated daily on week days.
Initial download of the metrics may take a while.