Fig. 32
Download original image
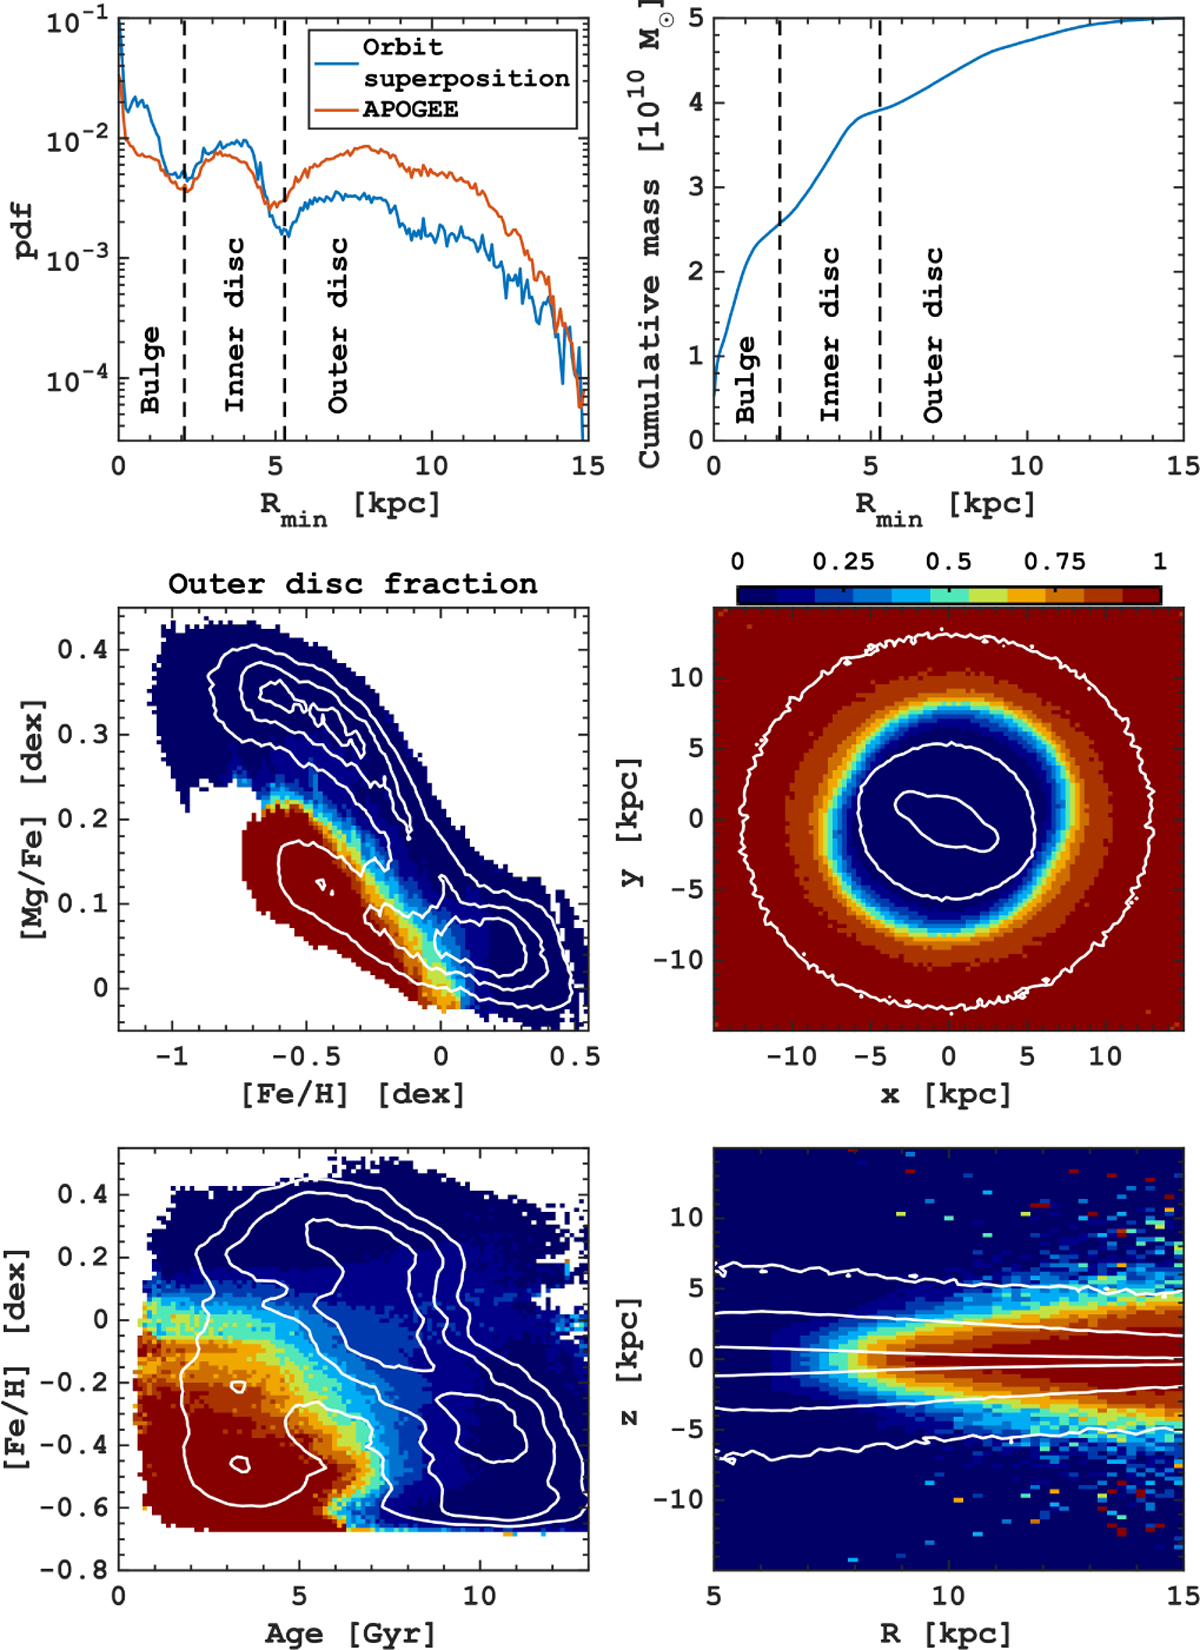
Kinematic definition of the MW outer disc. The top row shows the pdf (left) and cumulative mass distribution (right) as a function of pericentre values, Rmin. The vertical lines mark the local minima of the pdf on the left, setting up the boundaries between the bulge (Rmin < 2.1), inner (2.1 < Rmin < 5.5 kpc) and outer disc (Rmin > 5.3 kpc). The group of the bottom panels illustrate the outer disc selection in [Mg/Fe] − [Fe/H] (middle left), x − y (middle right), age–[Fe/H] (bottom left) and R − z (bottom right) coordinates. The maps are colour-coded by the stellar mass fraction of the outer disc relative to the total stellar mass in corresponding coordinates.
Current usage metrics show cumulative count of Article Views (full-text article views including HTML views, PDF and ePub downloads, according to the available data) and Abstracts Views on Vision4Press platform.
Data correspond to usage on the plateform after 2015. The current usage metrics is available 48-96 hours after online publication and is updated daily on week days.
Initial download of the metrics may take a while.