Fig. 7
Download original image
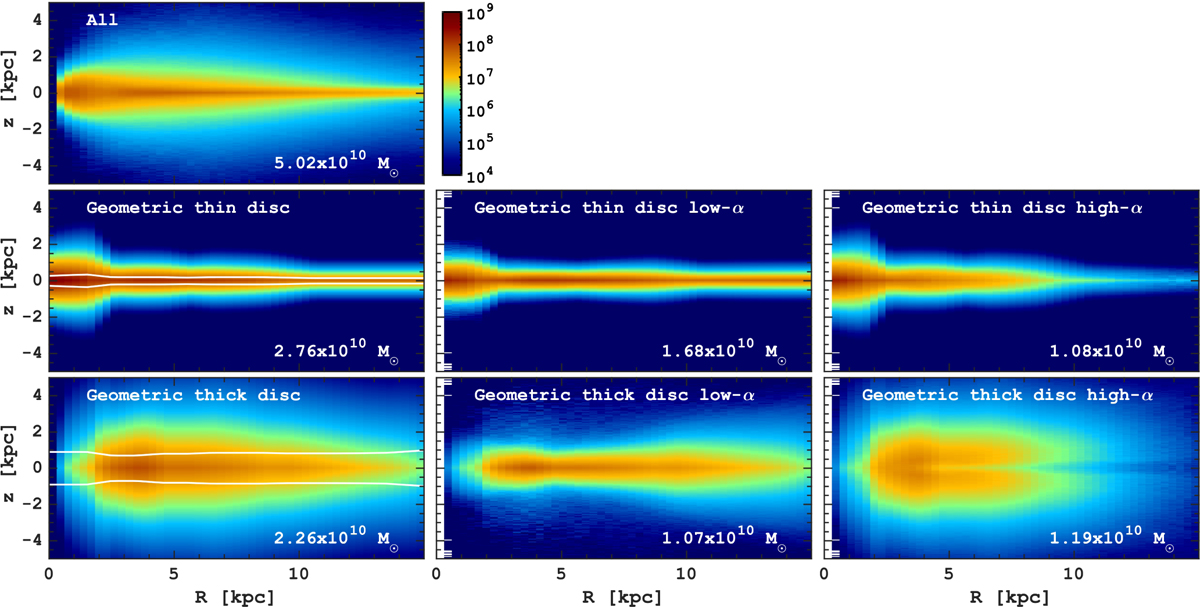
Decomposition of geometric thin and thick MW stellar discs. From top to bottom, the left panels show the stellar density distribution in R − z coordinates for all stellar populations, as well as geometric thin and thick discs. The geometric disc components structure is obtained by fitting the vertical density profiles with a double-exponential law. The middle and right panels show the structure of low- and high-α populations in geometric thin (second row) and thick components (bottom row). The purely chemical selection is shown in Fig. 4. The white lines in panels with geometric thin and thick discs show the corresponding exponential scale height. In each panel, the total stellar masses of corresponding components are given in the bottom right corner. The mass of the geometric thick disc is about 40%, which matches the mass of the high-α sequence. However, only half of the geometric thick MW disc is comprised of high-α populations.
Current usage metrics show cumulative count of Article Views (full-text article views including HTML views, PDF and ePub downloads, according to the available data) and Abstracts Views on Vision4Press platform.
Data correspond to usage on the plateform after 2015. The current usage metrics is available 48-96 hours after online publication and is updated daily on week days.
Initial download of the metrics may take a while.