Fig. 12
Download original image
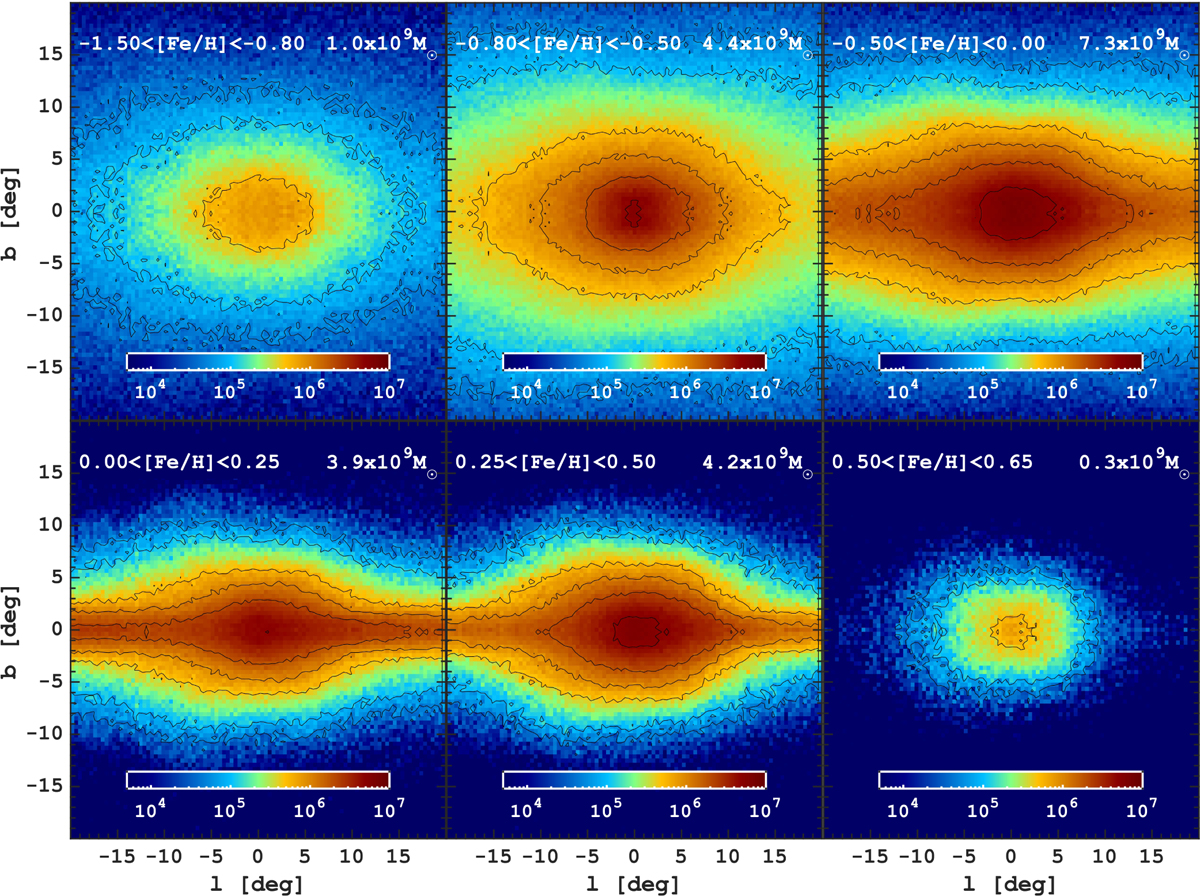
Shape of the MW bulge stellar density across different metallicity bins. The corresponding metallicity range and stellar mass are specified at the top of each panel. The top three panels represent the high-α populations, while the bottom panels depict the low-α populations. The mapping of these populations into the bulge reveals distinct trends where the contrast of the X-shaped/boxy structure increases with metallicity. High-α stars, corresponding to a kinematically hot thick disc component, are more widely dispersed in the bulge. In contrast, low-α stars are part of a colder population that is more closely confined to the midplane but still efficiently mapped into the bulge. The most (extremely) metal-rich populations exhibit a vertically extended, highly concentrated distribution towards the centre of the MW without displaying a prominent disc-like morphology. An animated version is available online.
Current usage metrics show cumulative count of Article Views (full-text article views including HTML views, PDF and ePub downloads, according to the available data) and Abstracts Views on Vision4Press platform.
Data correspond to usage on the plateform after 2015. The current usage metrics is available 48-96 hours after online publication and is updated daily on week days.
Initial download of the metrics may take a while.