Fig. 13
Download original image
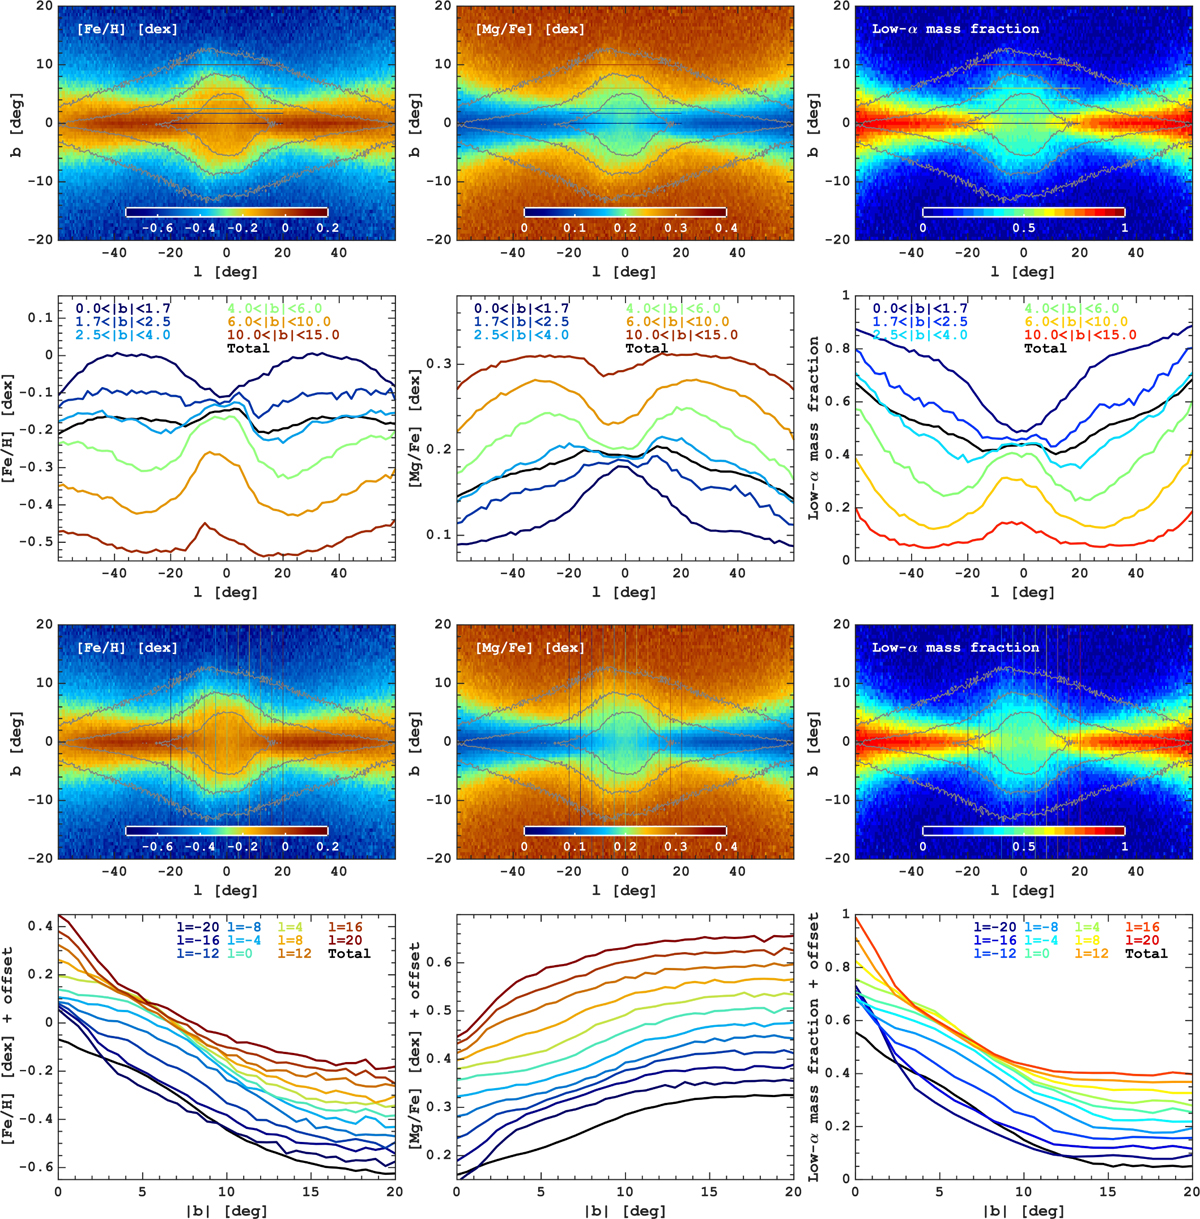
Chemical abundance profiles across the bulge region. The left and middle panels in the top row show the mean stellar mass-weighted [Fe/H] and [Mg/Fe], respectively, while the right one depicts the stellar mass fraction of the low-α populations (see Fig. 9 for the definition). The bottom panels show one-dimensional profiles of the same quantities as a function of longitude and at different latitudes, marked with different colours. The bottom group of panels shows the same, but for the vertical profiles, along latitude. The black lines at the bottom show the latitude- or longitude-averaged profiles. The grey background lines in the 2D abundance maps depict the stellar isodensity contours.
Current usage metrics show cumulative count of Article Views (full-text article views including HTML views, PDF and ePub downloads, according to the available data) and Abstracts Views on Vision4Press platform.
Data correspond to usage on the plateform after 2015. The current usage metrics is available 48-96 hours after online publication and is updated daily on week days.
Initial download of the metrics may take a while.