Fig. 14
Download original image
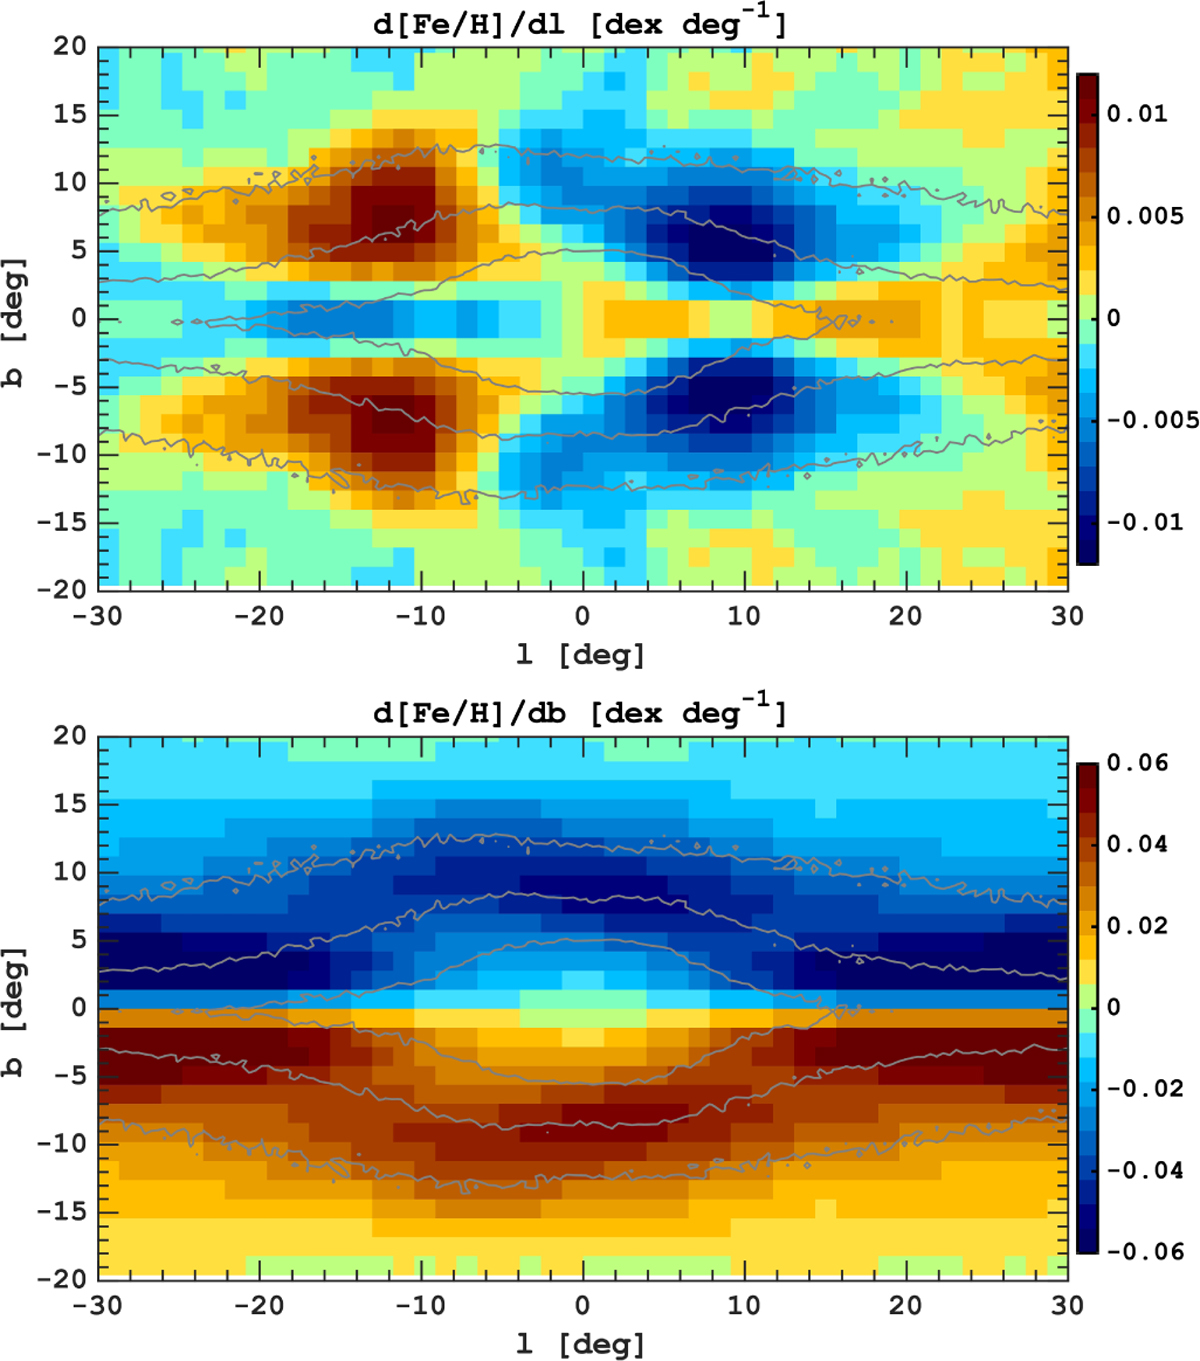
Maps of the radial (top) and vertical (bottom) metallicity gradients in the MW bulge region. The maps show the slopes of the metallicity profiles measured in each pixel within ±1 deg in the corresponding direction. The radial and vertical gradient variations trace well the X-shaped and boxy density components, respectively. The gradients are steeper near the transition regions between high- and low-α populations. The grey background lines reflect the projected stellar density distribution.
Current usage metrics show cumulative count of Article Views (full-text article views including HTML views, PDF and ePub downloads, according to the available data) and Abstracts Views on Vision4Press platform.
Data correspond to usage on the plateform after 2015. The current usage metrics is available 48-96 hours after online publication and is updated daily on week days.
Initial download of the metrics may take a while.