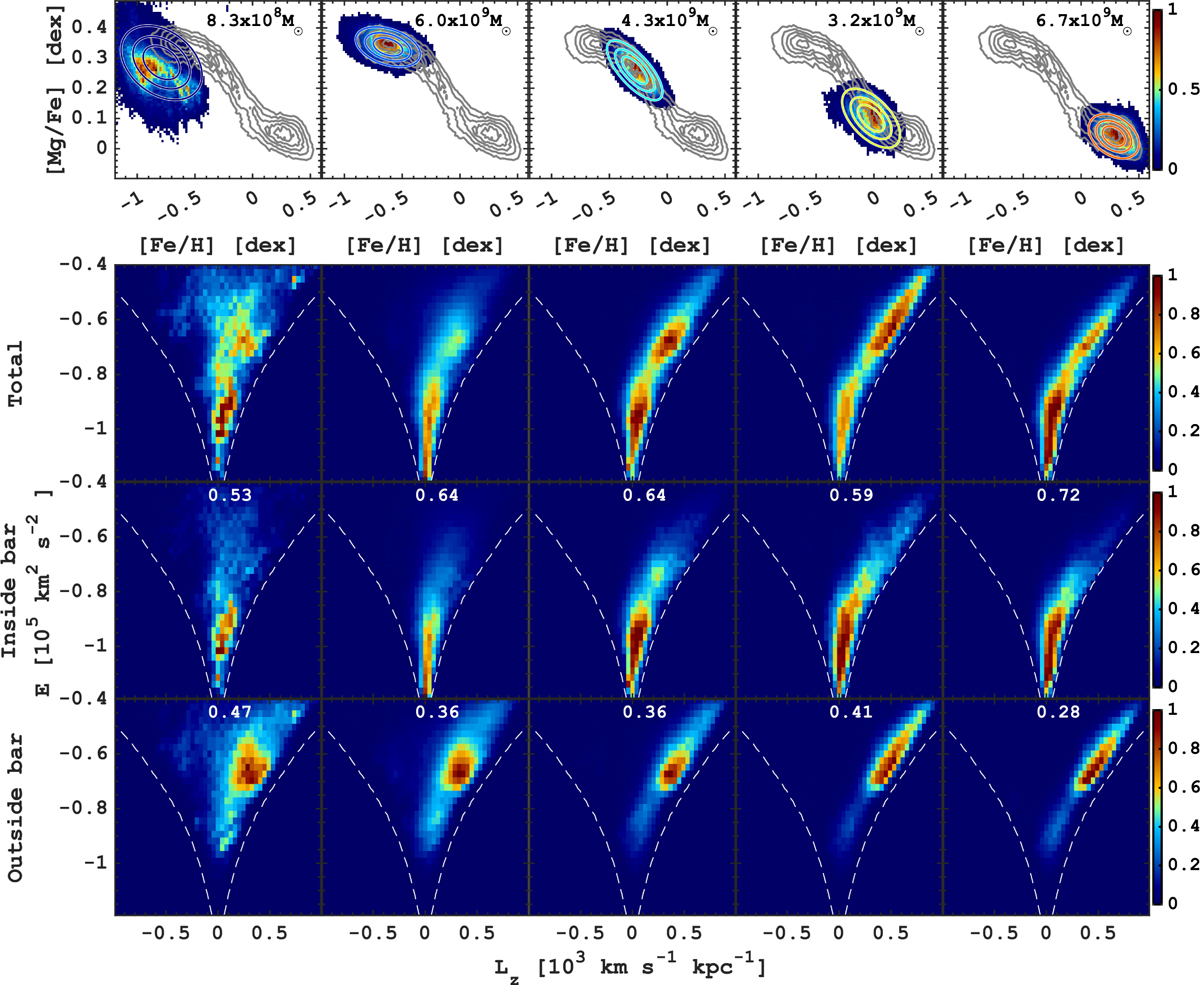
Fig. 18
Download original image
Energy-angular momentum structure of the MW bulge components identified using 2D GMM in the [Fe/H]–[Mg/Fe] plane. The top panels are the same as in Fig. 17 and are given for reference. The bottom group of panels show the normalised stellar mass for the entire component (top) and the region inside (middle) and outside (bottom) the bar. The numbers in the middle and bottom rows correspond to the mass fraction of a given component inside and outside the bar. The white dashed lines mark the minimum possible energy for a given value of the angular momentum.
Current usage metrics show cumulative count of Article Views (full-text article views including HTML views, PDF and ePub downloads, according to the available data) and Abstracts Views on Vision4Press platform.
Data correspond to usage on the plateform after 2015. The current usage metrics is available 48-96 hours after online publication and is updated daily on week days.
Initial download of the metrics may take a while.