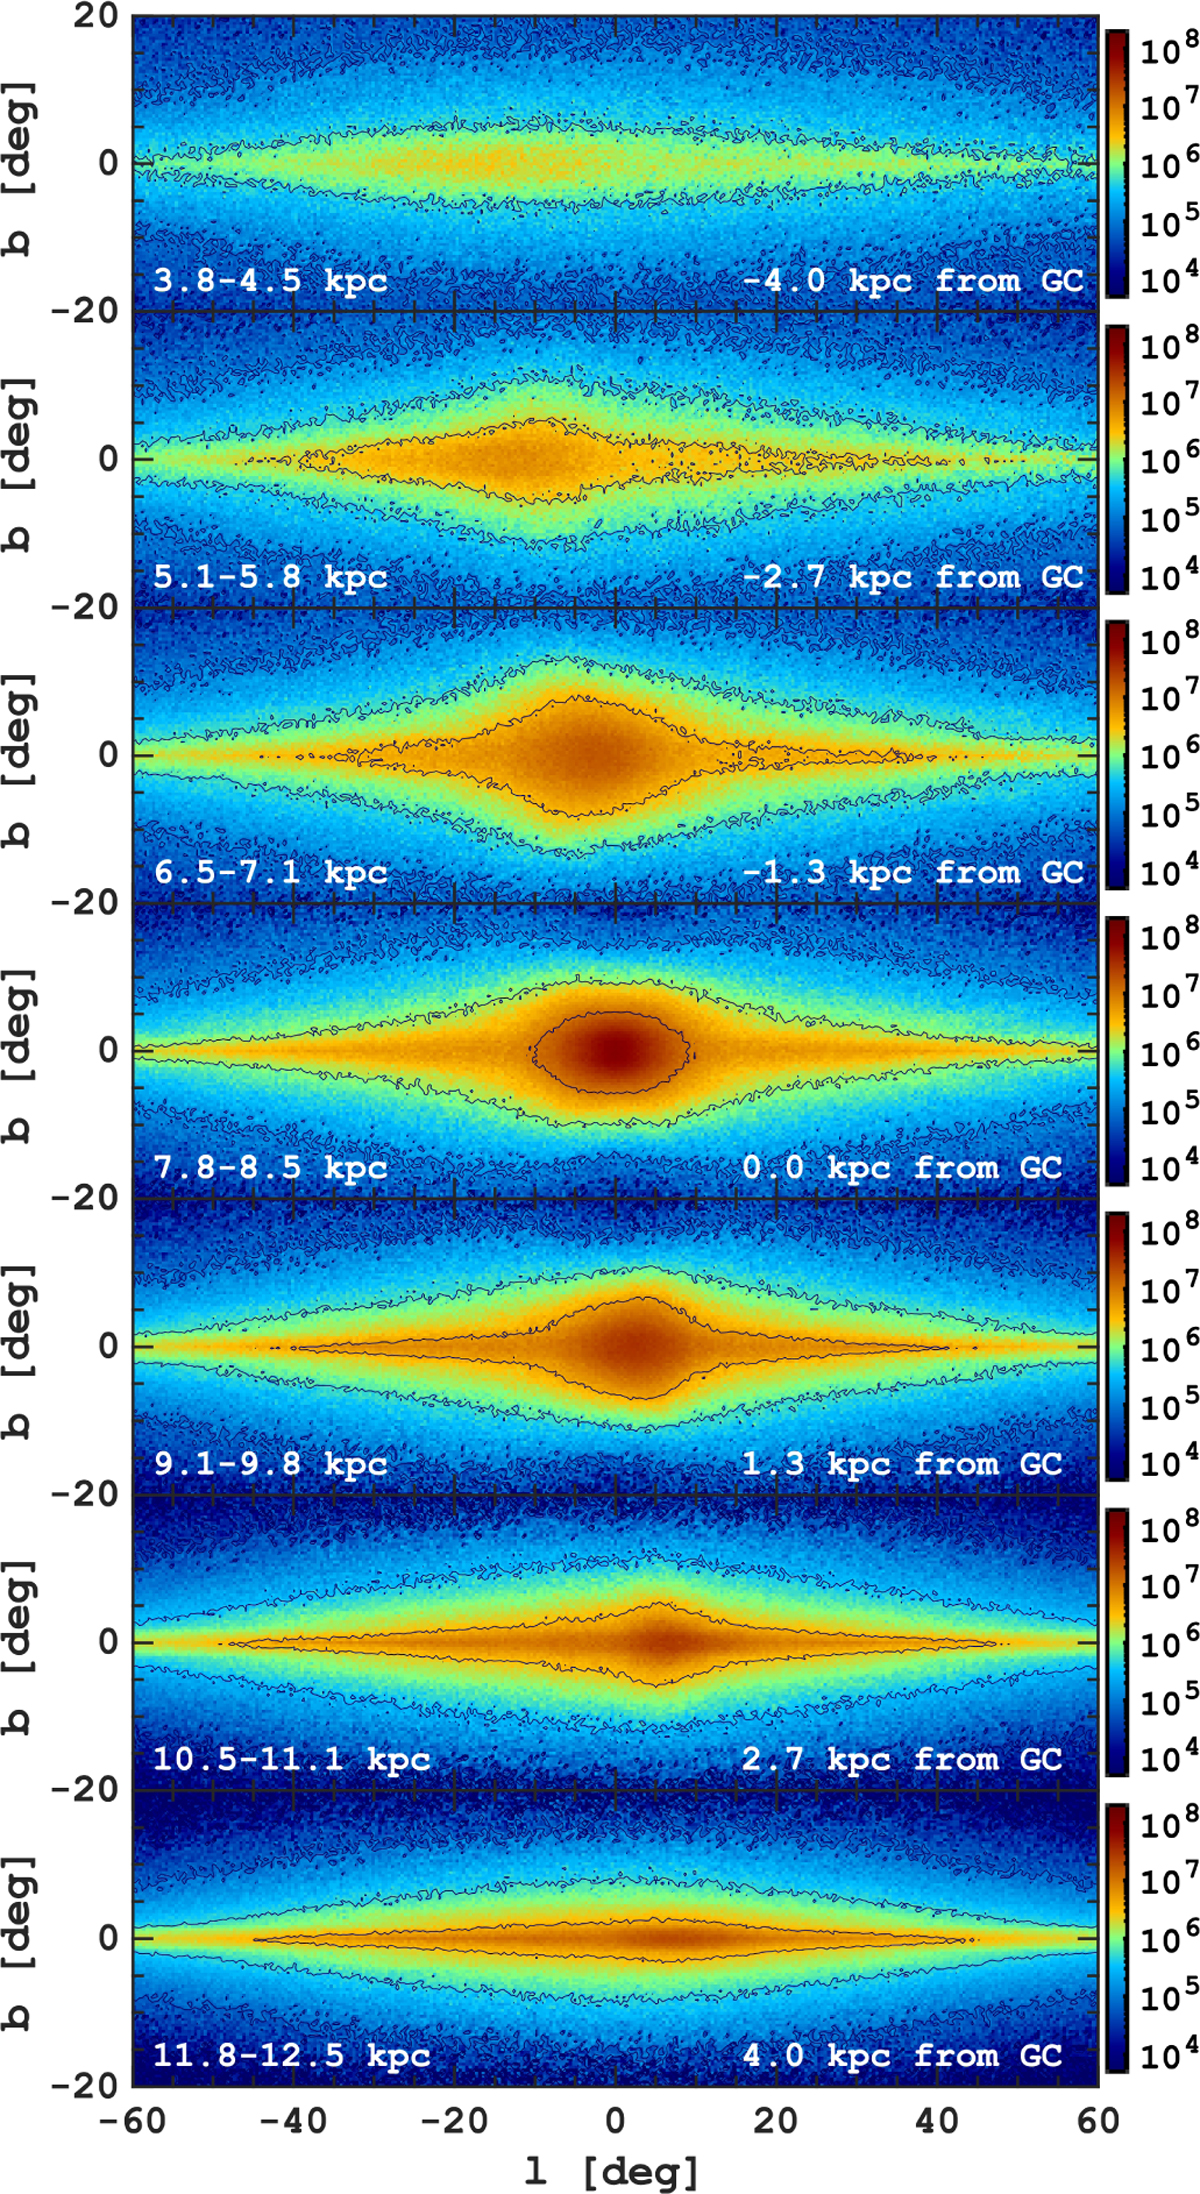
Fig. 2
Download original image
Variation of the inner MW density structure along the line-of-sight reconstructed using orbit superposition and APOGEE data. From top to bottom, the panels show the stellar density in (l,b) coordinates in 0.6 kpc-wide slices with increasing distances from the Sun, as marked in the bottom left of each panel. The middle panel shows the boxy bulge structure at the Galactic centre, while the upper and lower panels show the near and far sides of the bar-bulge, respectively. As we slice the MW bar inclined relative to the Sun – Galactic centre line, the off-centred X-shaped structure transitions from negative to positive longitudes with increasing distance.
Current usage metrics show cumulative count of Article Views (full-text article views including HTML views, PDF and ePub downloads, according to the available data) and Abstracts Views on Vision4Press platform.
Data correspond to usage on the plateform after 2015. The current usage metrics is available 48-96 hours after online publication and is updated daily on week days.
Initial download of the metrics may take a while.