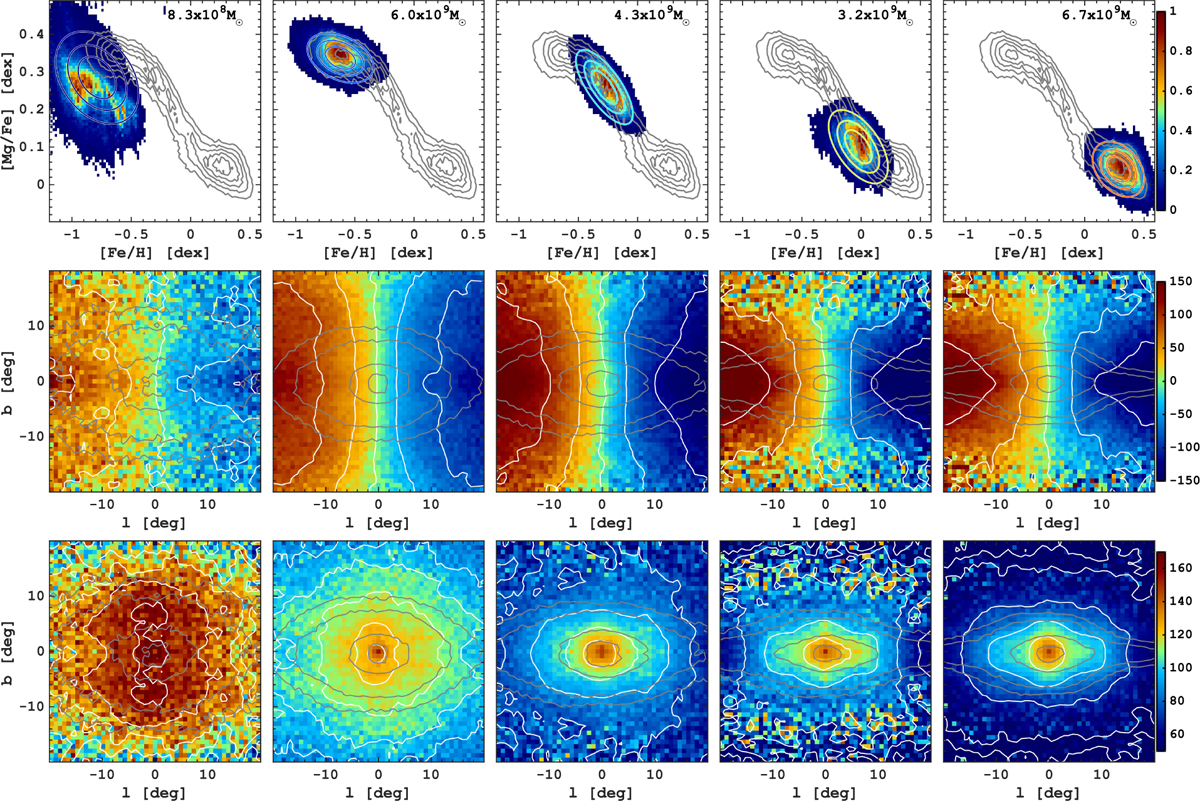
Fig. A.2
Download original image
Kinematics of the MW bulge populations identified using 2D GMM in the [Fe/H]-[Mg/Fe] plane. The top panels are the same as in Fig. 17 and are given for reference. The middle and bottom panels show each component’s line-of-sight velocity and dispersion maps, weighted by the mass multiplied by the GMM probabilities. The grey contours show the corresponding density distribution, while the white ones highlight the velocity/dispersion structure.
Current usage metrics show cumulative count of Article Views (full-text article views including HTML views, PDF and ePub downloads, according to the available data) and Abstracts Views on Vision4Press platform.
Data correspond to usage on the plateform after 2015. The current usage metrics is available 48-96 hours after online publication and is updated daily on week days.
Initial download of the metrics may take a while.