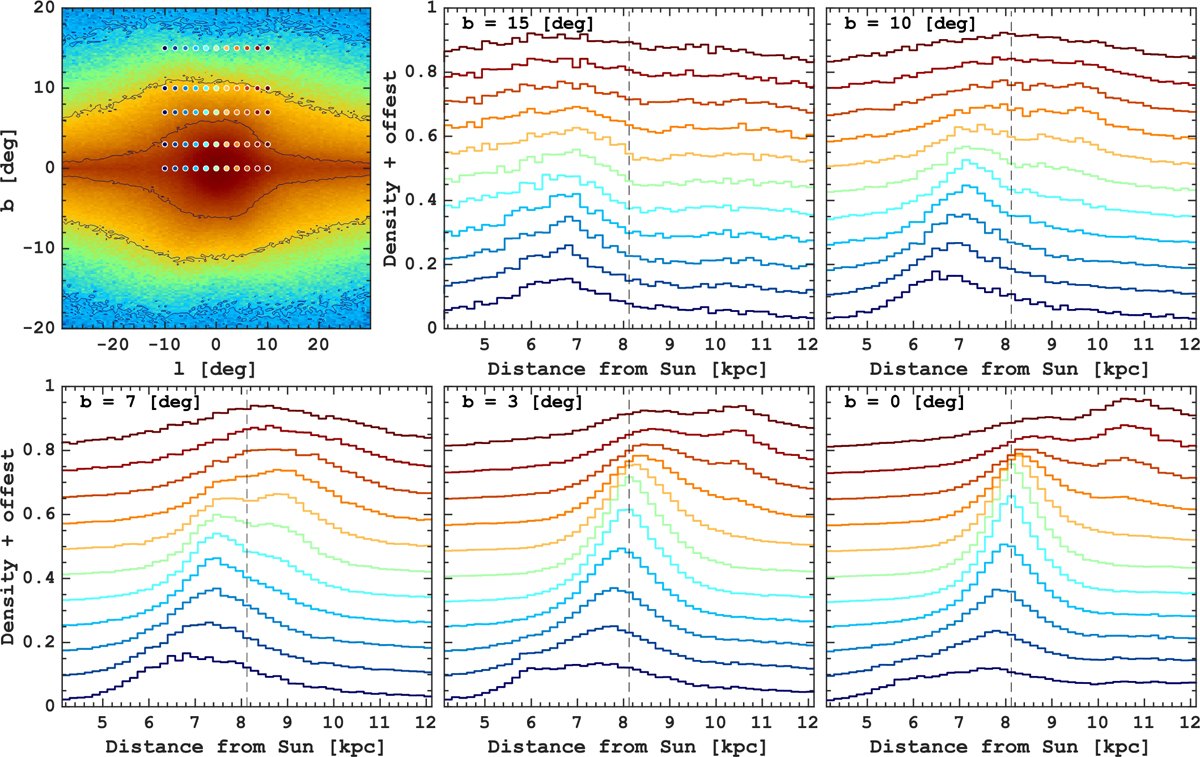
Fig. 3
Download original image
Line-of-sight density structure of the MW bulge reconstructed using orbit superposition and APOGEE data. The top left panel shows the selection of the bulge fields marked by circles of different colours with the total column stellar density on the background. Other panels show the stellar density distribution along the line-of-sight at different latitudes, as is marked in the top left panel. The colour of the lines matches the colour of the circles in the top left panel. Only fields with b ≥ 0 are shown as the data are symmetric relative to the midplane. An animated version is available online.
Current usage metrics show cumulative count of Article Views (full-text article views including HTML views, PDF and ePub downloads, according to the available data) and Abstracts Views on Vision4Press platform.
Data correspond to usage on the plateform after 2015. The current usage metrics is available 48-96 hours after online publication and is updated daily on week days.
Initial download of the metrics may take a while.