Fig. 6
Download original image
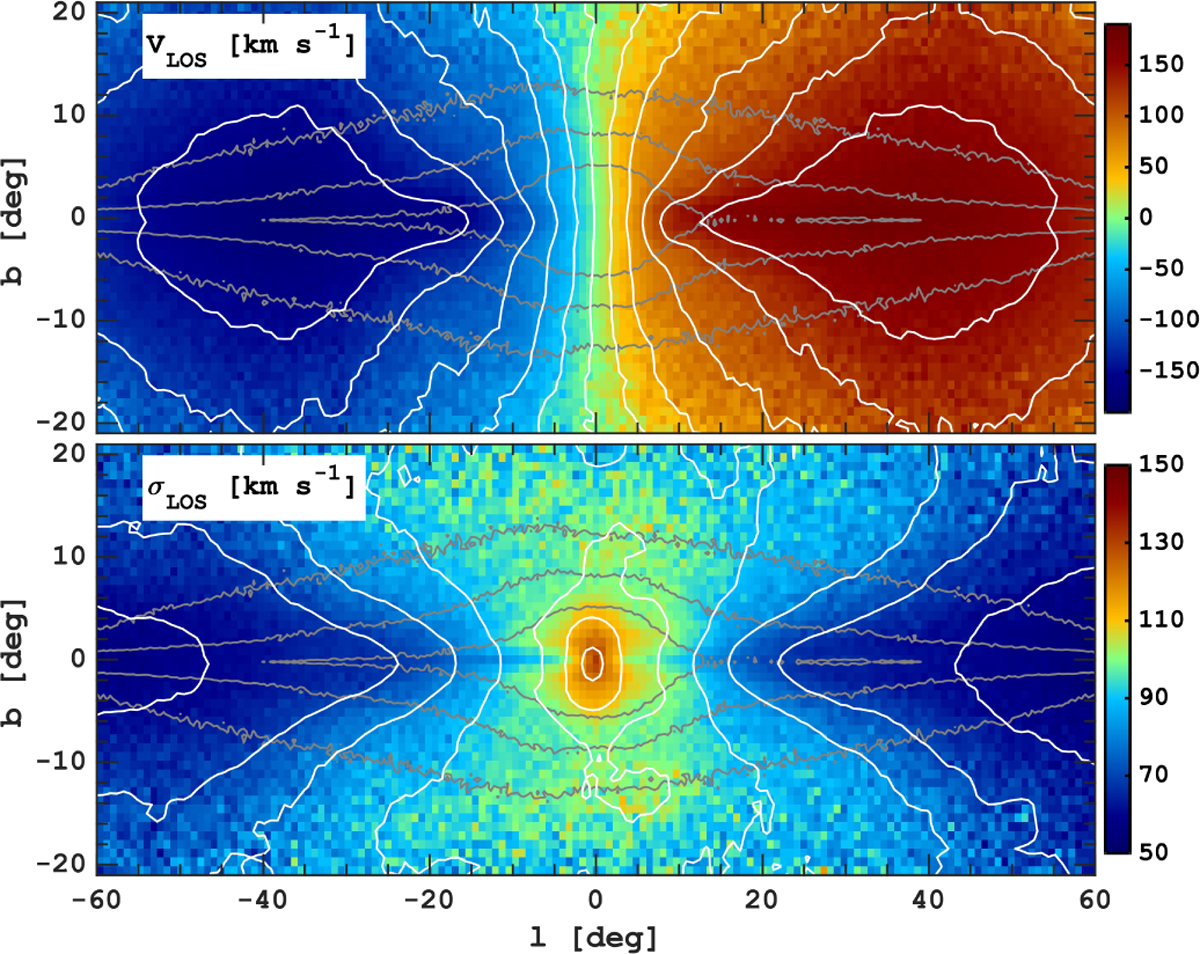
Kinematics of the MW bulge recovered using orbit superposition approach. The panels show the mean line-of-sight velocity (top) and the line-of-sight velocity dispersion (bottom) in the MW bulge region, limited by a heliocentric distance of 8.12 ± 3.5 kpc, around the Galactic centre. The grey contours reflect the shape of the stellar density distribution, while the white ones correspond to the constant velocity and velocity dispersion values. The bulge region shows a prominent rotation due to its disc origin, while the asymmetry of the radial velocity profile is due to projection effects. The velocity dispersion map shows a prominent peak extended perpendicular to the midplane.
Current usage metrics show cumulative count of Article Views (full-text article views including HTML views, PDF and ePub downloads, according to the available data) and Abstracts Views on Vision4Press platform.
Data correspond to usage on the plateform after 2015. The current usage metrics is available 48-96 hours after online publication and is updated daily on week days.
Initial download of the metrics may take a while.