Fig. 7
Download original image
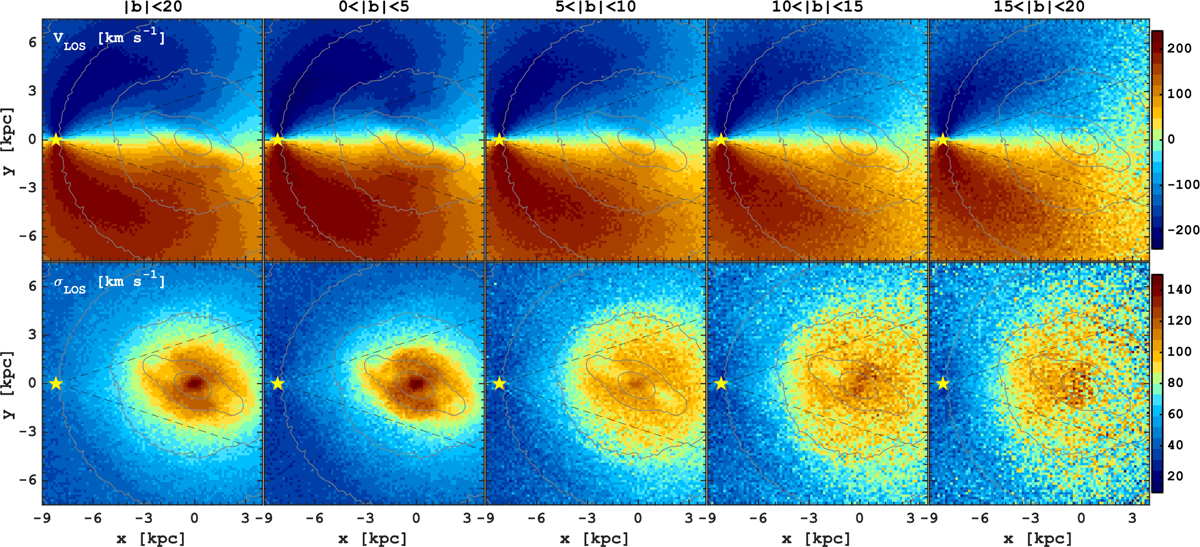
Kinematics of the inner MW and bulge in the face-on projection. The panels show the mean heliocentric line-of-sight velocity (top) and velocity dispersion (bottom) maps at different latitudes. The grey contours show the total stellar isodensity levels, marking the extent and orientation of the bar. The dashed lines highlight the longitude values of l ± 20°. The yellow asterisks mark the position of the Sun.
Current usage metrics show cumulative count of Article Views (full-text article views including HTML views, PDF and ePub downloads, according to the available data) and Abstracts Views on Vision4Press platform.
Data correspond to usage on the plateform after 2015. The current usage metrics is available 48-96 hours after online publication and is updated daily on week days.
Initial download of the metrics may take a while.