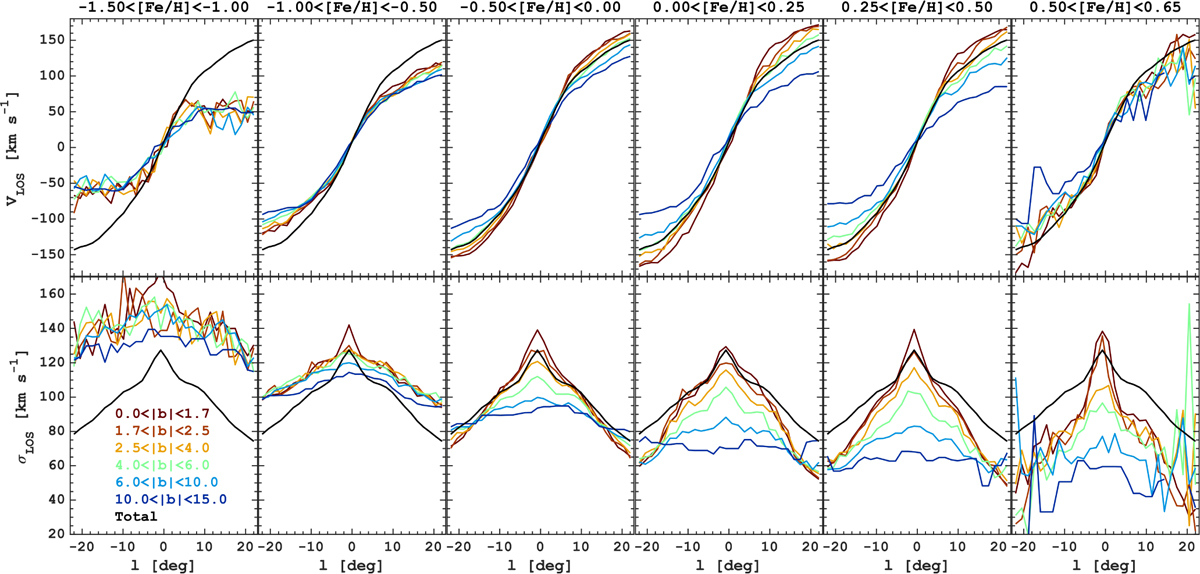
Fig. 8
Download original image
Line-of-sight kinematics of the MW bulge. The panels show the mean line-of-sight radial velocity (top) and the line-of-sight velocity dispersion (bottom) versus longitude measured at different latitudes and in [Fe/H] bins, as marked in the header of the top panels. The line colour indicates the latitude range. The panels are based on the data within <3.5 kpc around the Galactic centre. In each panel, the black lines show the averaged velocity and velocity dispersion profiles for all stellar populations of the entire region.
Current usage metrics show cumulative count of Article Views (full-text article views including HTML views, PDF and ePub downloads, according to the available data) and Abstracts Views on Vision4Press platform.
Data correspond to usage on the plateform after 2015. The current usage metrics is available 48-96 hours after online publication and is updated daily on week days.
Initial download of the metrics may take a while.