Fig. 9
Download original image
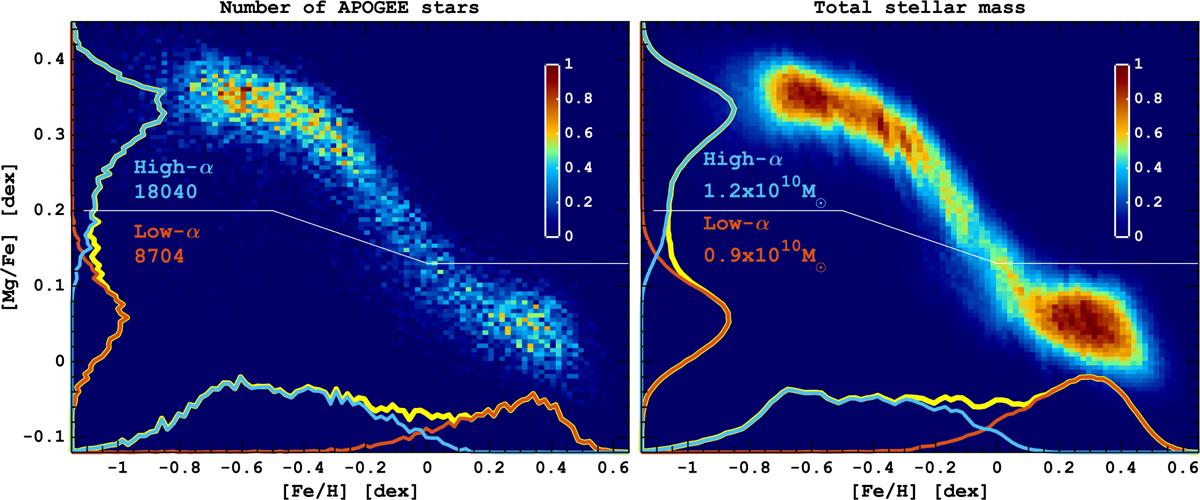
[Mg/Fe]-[Fe/H] relation for the MW bulge. The left panel shows the distribution of APOGEE stars, while the right panel depicts the mass-weighted distribution obtained using the orbit superposition method within <3.5 kpc from the Galactic centre. The yellow lines show the distribution functions of [Mg/Fe] and [Fe/H] separately. The solid white line shows the border used to separate high- and low-α populations. The number of stars and stellar mass corresponding to the high- and low-α populations are marked in the panels. While the orbit superposition method assigns more mass to the metal-rich populations, both APOGEE data and the orbit superposition-based density reveal rather similar abundance distributions.
Current usage metrics show cumulative count of Article Views (full-text article views including HTML views, PDF and ePub downloads, according to the available data) and Abstracts Views on Vision4Press platform.
Data correspond to usage on the plateform after 2015. The current usage metrics is available 48-96 hours after online publication and is updated daily on week days.
Initial download of the metrics may take a while.