Fig. 1
Download original image
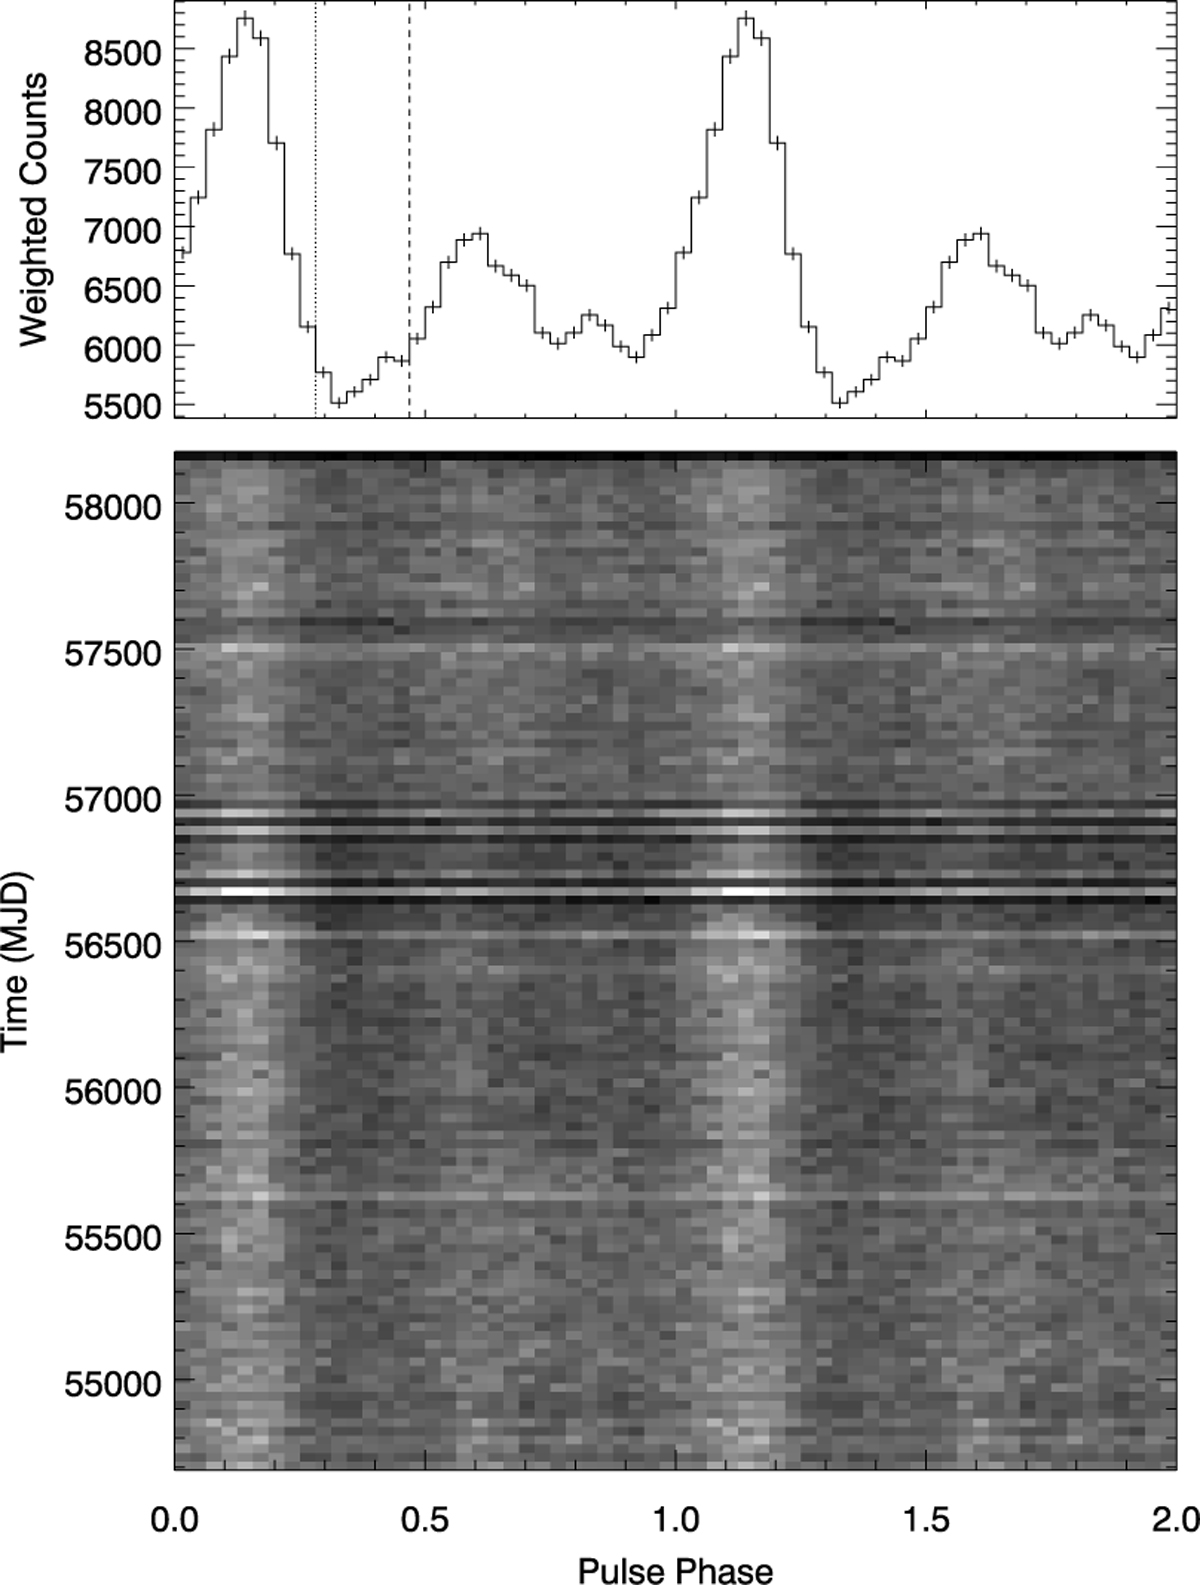
Folded pulse profile and two-dimensional phaseogram in 32 phase bins derived for PSR J2021+4026. The grayscale represents the weights of photons in each bin. White indicates a higher weight, and black indicates a lower weight. The dotted and dashed lines mark the minimum and maximum phases of the off-pulse phase interval, respectively.
Current usage metrics show cumulative count of Article Views (full-text article views including HTML views, PDF and ePub downloads, according to the available data) and Abstracts Views on Vision4Press platform.
Data correspond to usage on the plateform after 2015. The current usage metrics is available 48-96 hours after online publication and is updated daily on week days.
Initial download of the metrics may take a while.