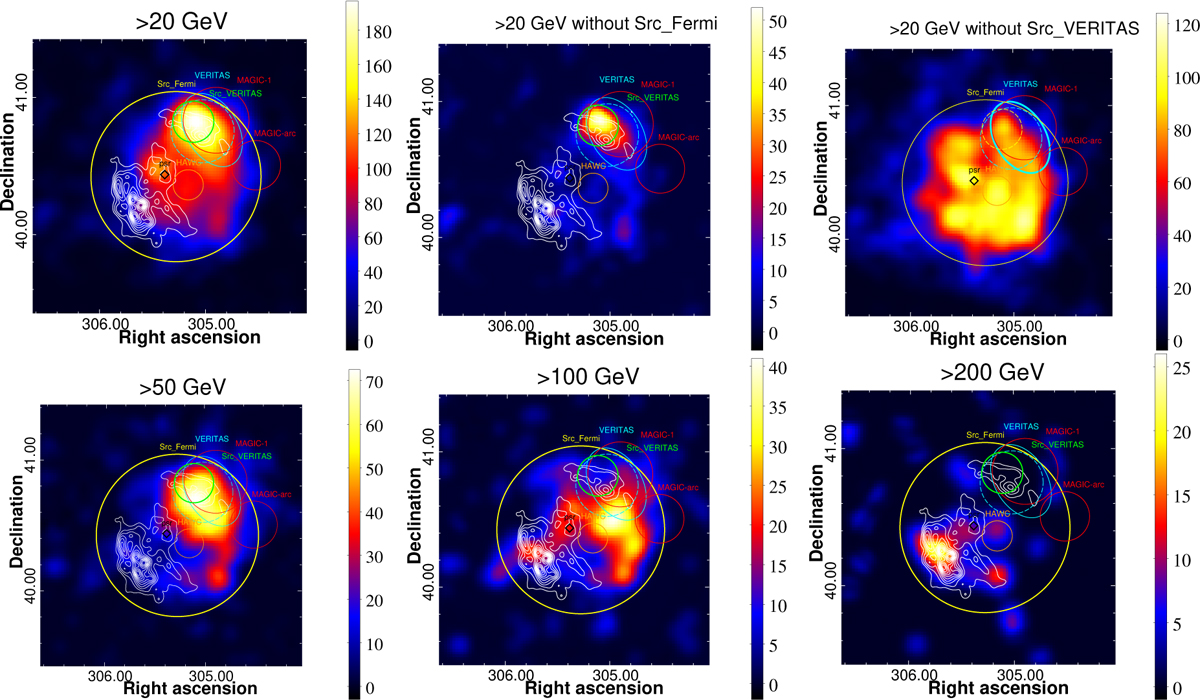
Fig. 3
Download original image
Fermi-LAT TS maps in the vicinity of γ–Cygni. The energy range for each panel is shown above them. The solid yellow and green circles show the extension size of the best-fit two Gaussian template (R68). The red circles show the two extended TeV sources measured by MAGIC (MAGIC Collaboration 2023), called MAGIC-1 and MAGIC-arc, respectively. The cyan circle and ellipse show the VERITAS results (Aliu et al. 2013; Abeysekara et al. 2018). The orange circle shows the center of the HAWC source with the 1 σ error radius (Abeysekara et al. 2017b). The black diamond shows the position of the gamma-ray pulsar PSR J2021+4026 (Abdo et al. 2009a) as in Figure 2. The white contours come from the CGPS 1420 MHz radio observation of the SNR shell structure (Ladouceur & Pineault 2008).
Current usage metrics show cumulative count of Article Views (full-text article views including HTML views, PDF and ePub downloads, according to the available data) and Abstracts Views on Vision4Press platform.
Data correspond to usage on the plateform after 2015. The current usage metrics is available 48-96 hours after online publication and is updated daily on week days.
Initial download of the metrics may take a while.