Fig. 4
Download original image
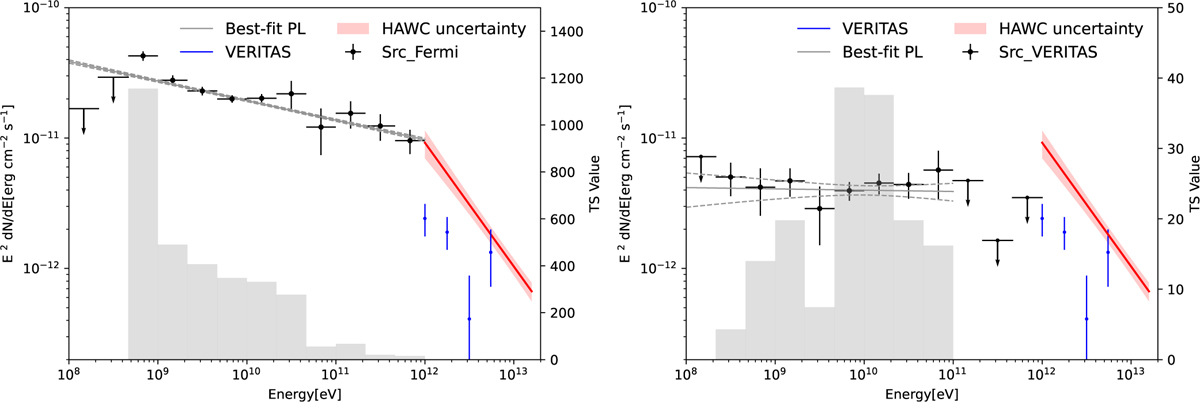
γ-ray SED obtained from the events in 0.1–1000 GeV shown as black data points. The gray solid line shows the best-fit PL spectra for each component. The dashed lines show the 68% confidence bands. The arrows indicate the 95% upper limits when the TS value is lower than 4 in a given bin. The blue data points are the VERITAS results (Abeysekara et al. 2018). The red butterfly was extracted from Abeysekara et al. (2017b). The gray histogram denotes the TS value for each bin.
Current usage metrics show cumulative count of Article Views (full-text article views including HTML views, PDF and ePub downloads, according to the available data) and Abstracts Views on Vision4Press platform.
Data correspond to usage on the plateform after 2015. The current usage metrics is available 48-96 hours after online publication and is updated daily on week days.
Initial download of the metrics may take a while.