Fig. 5
Download original image
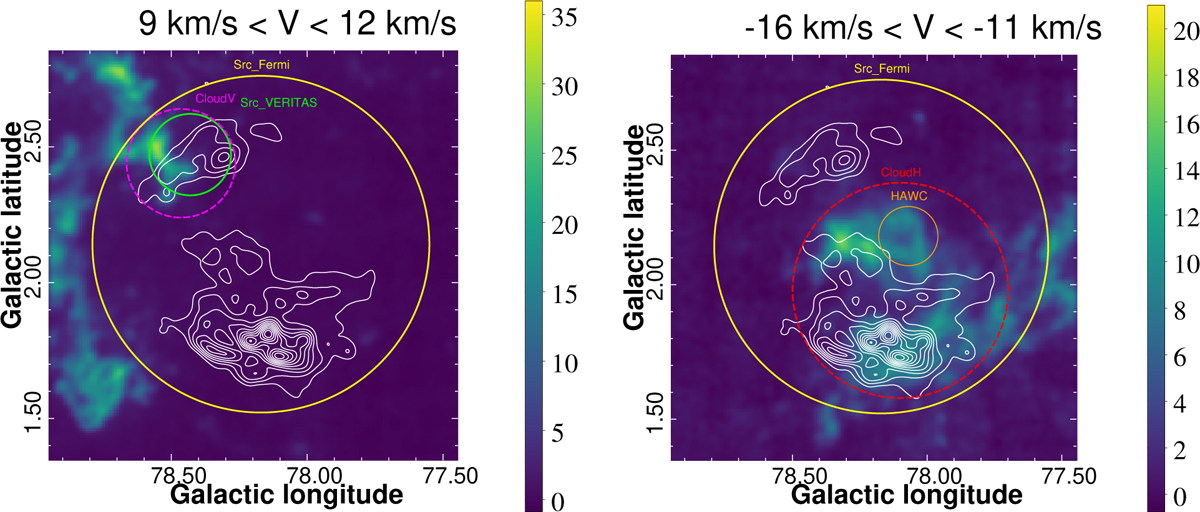
Integrated 12CO (J = 1–0) emission intensity (K km s−1) toward γ-Cygni region in the velocity ranges [+9.0, +12.0] km s−1 (left panel) and [−16.0, −11.0] km s−1 (right panel) using MWISP data. The solid circles are the same as in Figure 3. The dashed magenta and red circles correspond to different regions that are affected by escaped CRs, called CloudV and CloudH, respectively.
Current usage metrics show cumulative count of Article Views (full-text article views including HTML views, PDF and ePub downloads, according to the available data) and Abstracts Views on Vision4Press platform.
Data correspond to usage on the plateform after 2015. The current usage metrics is available 48-96 hours after online publication and is updated daily on week days.
Initial download of the metrics may take a while.