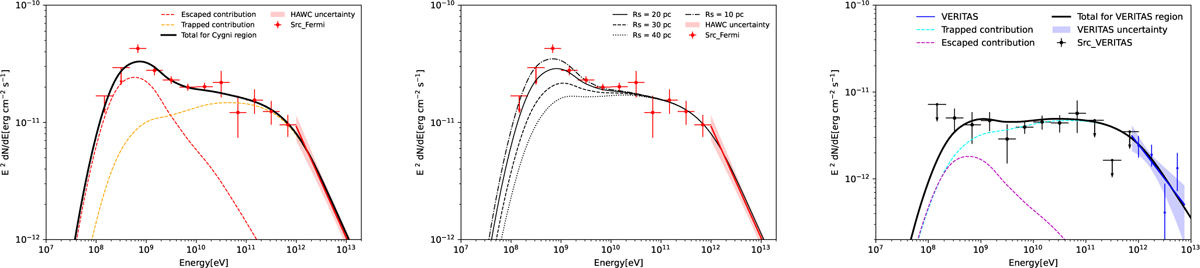
Fig. 6
Download original image
Modeling the γ-ray spectrum in the hadronic scenario. Left panel: total contribution (solid black line) from the sum of the dashed red and orange lines, corresponding to the escaped and trapped ions, respectively. The red butterfly was extracted from Abeysekara et al. (2017b). Middle panel: total γ-ray contribution calculated with different rs. Right panel: predicted γ-ray flux in the VERITAS region, obtained by adding the escaped and trapped components. The blue data points and butterfly were taken from Abeysekara et al. (2018).
Current usage metrics show cumulative count of Article Views (full-text article views including HTML views, PDF and ePub downloads, according to the available data) and Abstracts Views on Vision4Press platform.
Data correspond to usage on the plateform after 2015. The current usage metrics is available 48-96 hours after online publication and is updated daily on week days.
Initial download of the metrics may take a while.