Fig. 6.
Download original image
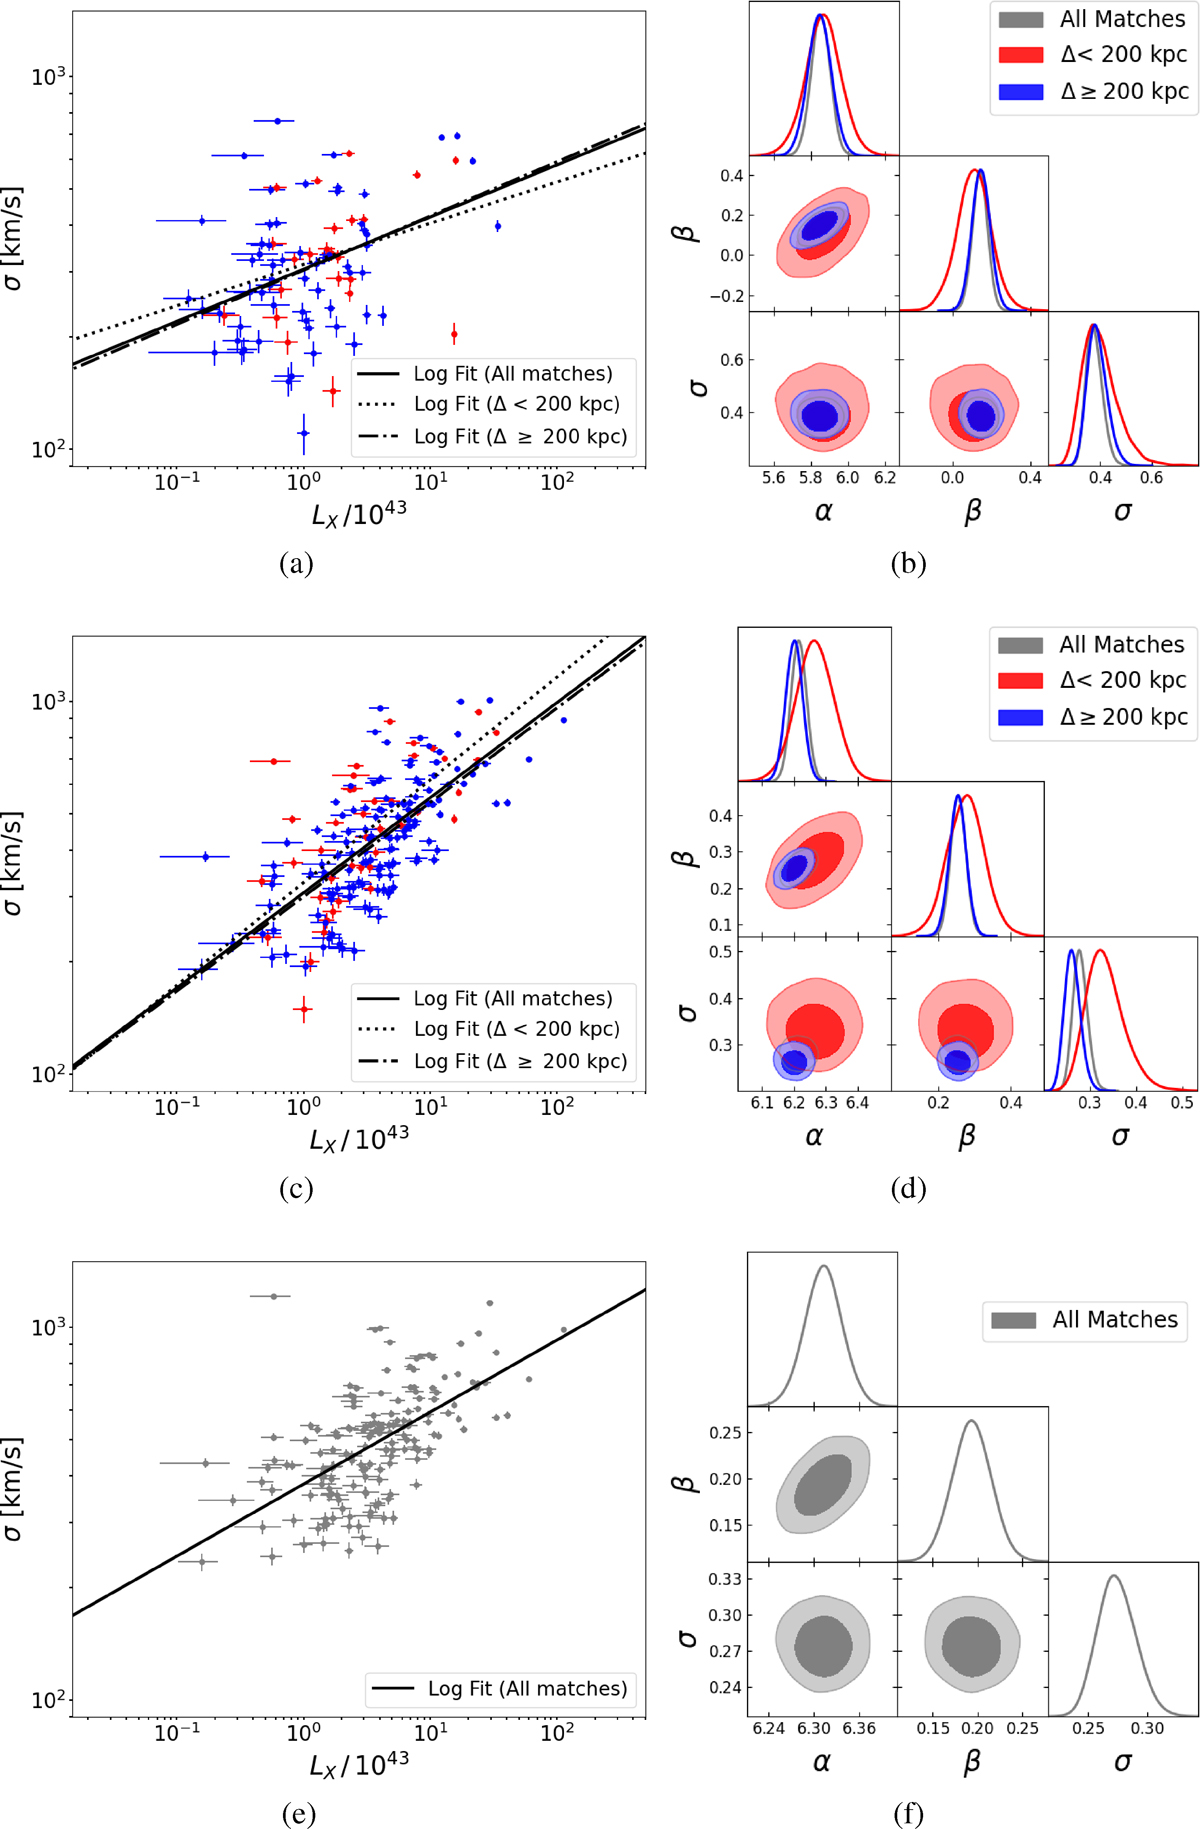
Left panels: Scaling relations between velocity dispersion (σ) and X-ray luminosity (LX) for the optical/X-ray matches found using angular MHD cuts. Δ is defined as the 2D distance between optical and X-ray centers for each match. The power law fits for both subsets, as well as the full set of matches, were found via Monte Carlo simulation. For clarity, only the mean fits are plotted. The power law fits were calculated using natural log, but the figure axes are displayed in decimal log. For the top two panels on this side, the data is split between matches for which the distance between the optical and X-ray centers is less than (red) or greater than (blue) 200 kpc. (a) Scaling relation for matches using the v180 volume-limited catalog. (c) Scaling relation for matches using the v195 volume-limited catalog. (e) Scaling relation for matches using the cleaned version of the v195 volume-limited catalog, with the group membership being determined by the maximum MHD limit of the v195 catalog. Right panels: Comparison of key parameter posteriors from the Monte Carlo simulation used to find the power law fits for the scaling relations in the corresponding panels in the left column. Posteriors are show for the fit to all matches (gray), for matches whose X-ray and optical centers are less than 200 kpc away (red), and for matches with centers further apart than 200 kpc (blue).
Current usage metrics show cumulative count of Article Views (full-text article views including HTML views, PDF and ePub downloads, according to the available data) and Abstracts Views on Vision4Press platform.
Data correspond to usage on the plateform after 2015. The current usage metrics is available 48-96 hours after online publication and is updated daily on week days.
Initial download of the metrics may take a while.