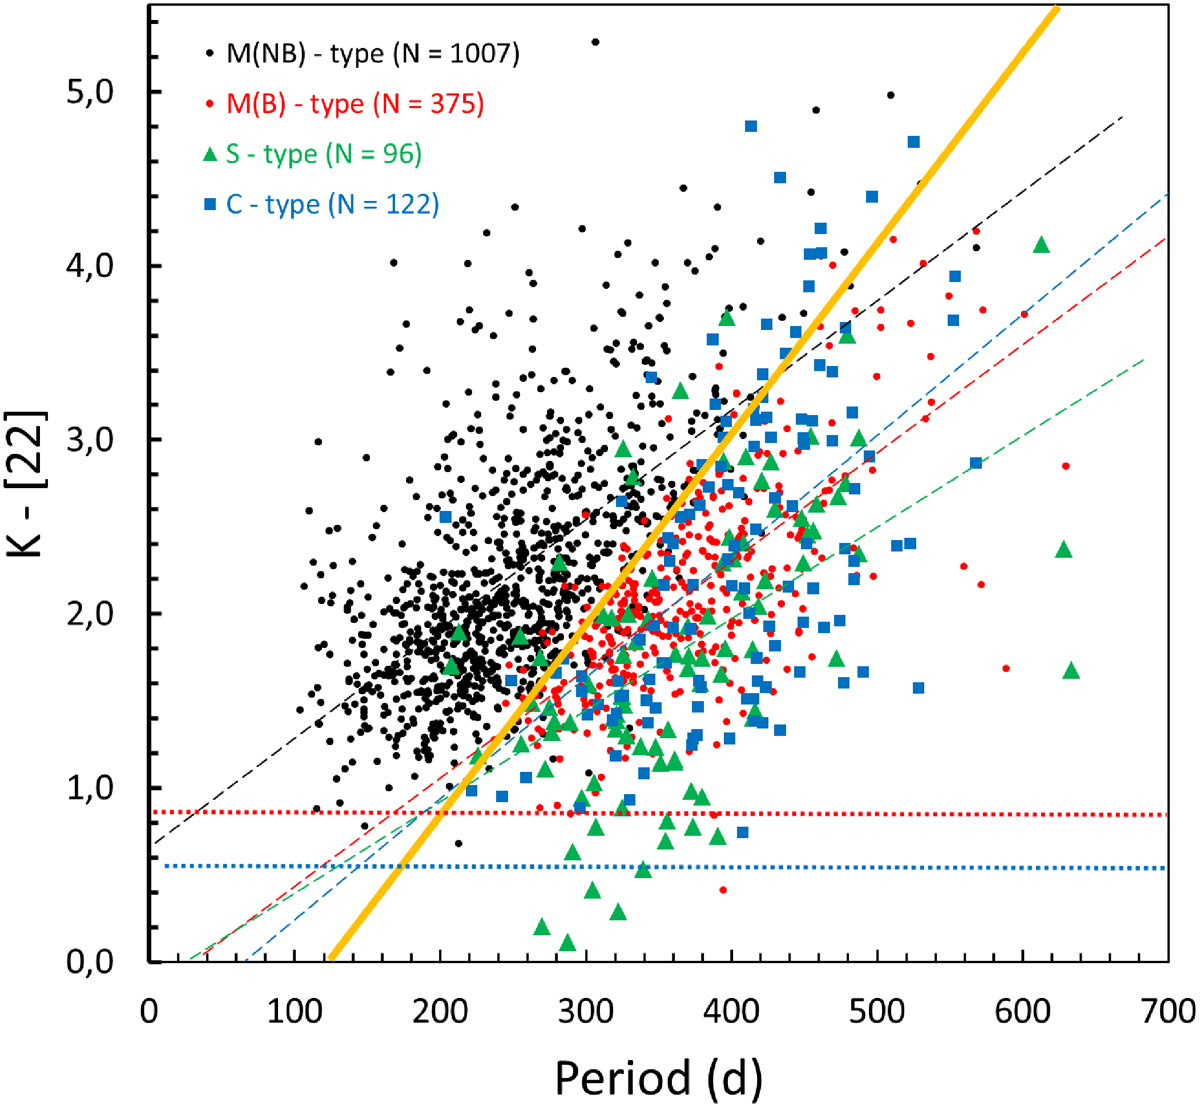
Fig. 9.
Download original image
K − [22] vs P diagram of the 1600 stars unsaturated in the K and [22] bands and with a known spectral type; see the legend for identification of the spectral types and the number of Miras in each group. The solid orange line is the relation given by Eq. (2) that best separates Group S and A Miras. The dashed lines are the linear least-square fits to the four groups of Miras listed in Table 4 (black: M(NB), red: M(B), green: S, blue: C Miras). The dotted blue and red lines indicate the limits of K − [22] = 0.55 and 0.85.
Current usage metrics show cumulative count of Article Views (full-text article views including HTML views, PDF and ePub downloads, according to the available data) and Abstracts Views on Vision4Press platform.
Data correspond to usage on the plateform after 2015. The current usage metrics is available 48-96 hours after online publication and is updated daily on week days.
Initial download of the metrics may take a while.