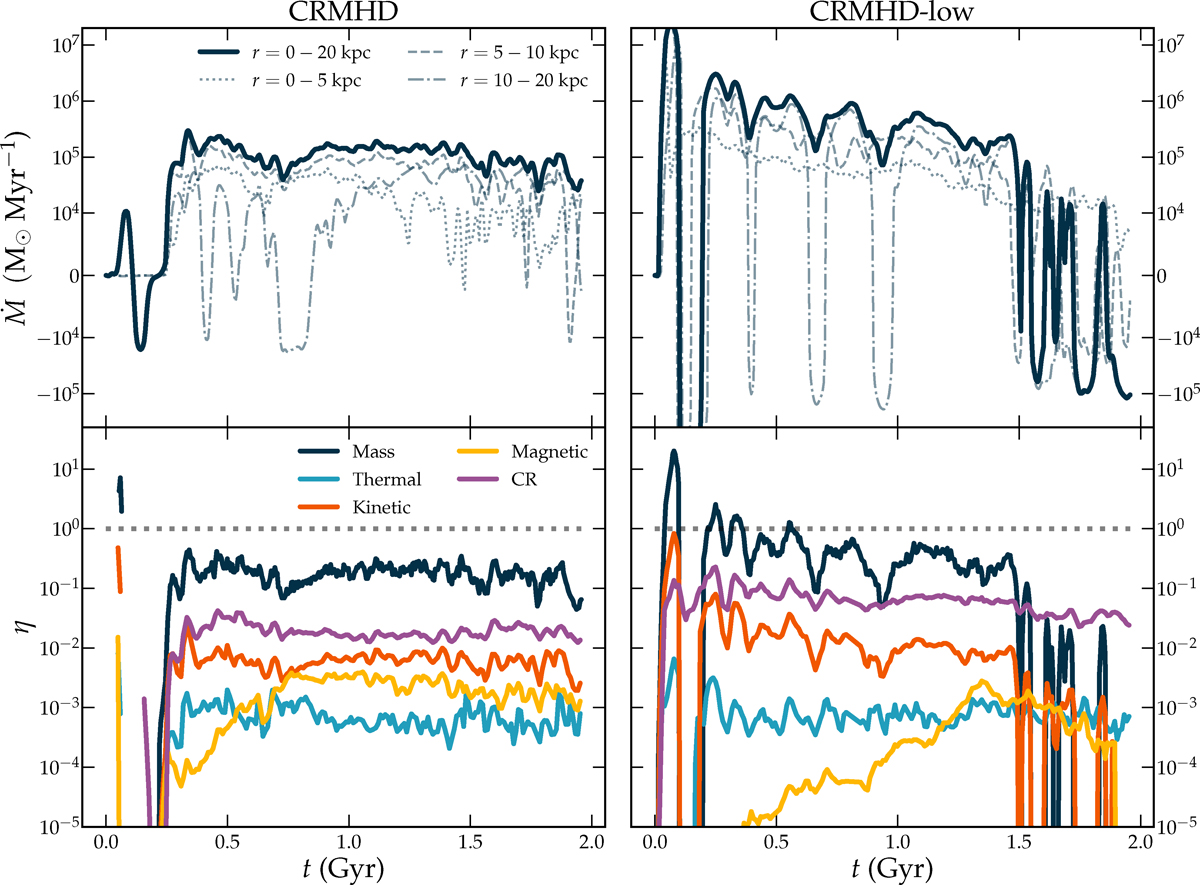
Fig. 10.
Download original image
Evolution of the mass flow rate. In the two upper panels we show the evolution of the mass outflow rate (mass flux) in the vertical direction at a height of h = 5 kpc in different radial bins, denoted by different linestyles, for the simulations CRMHD and CRMHD-low. Negative values correspond to net inflow. In the lower panels we show the mass-loading factor and energy loading factors, defined in Eqs. (19)–(22), calculated at the same height as the mass outflow rates and for radii r < 20 kpc.
Current usage metrics show cumulative count of Article Views (full-text article views including HTML views, PDF and ePub downloads, according to the available data) and Abstracts Views on Vision4Press platform.
Data correspond to usage on the plateform after 2015. The current usage metrics is available 48-96 hours after online publication and is updated daily on week days.
Initial download of the metrics may take a while.