Open Access
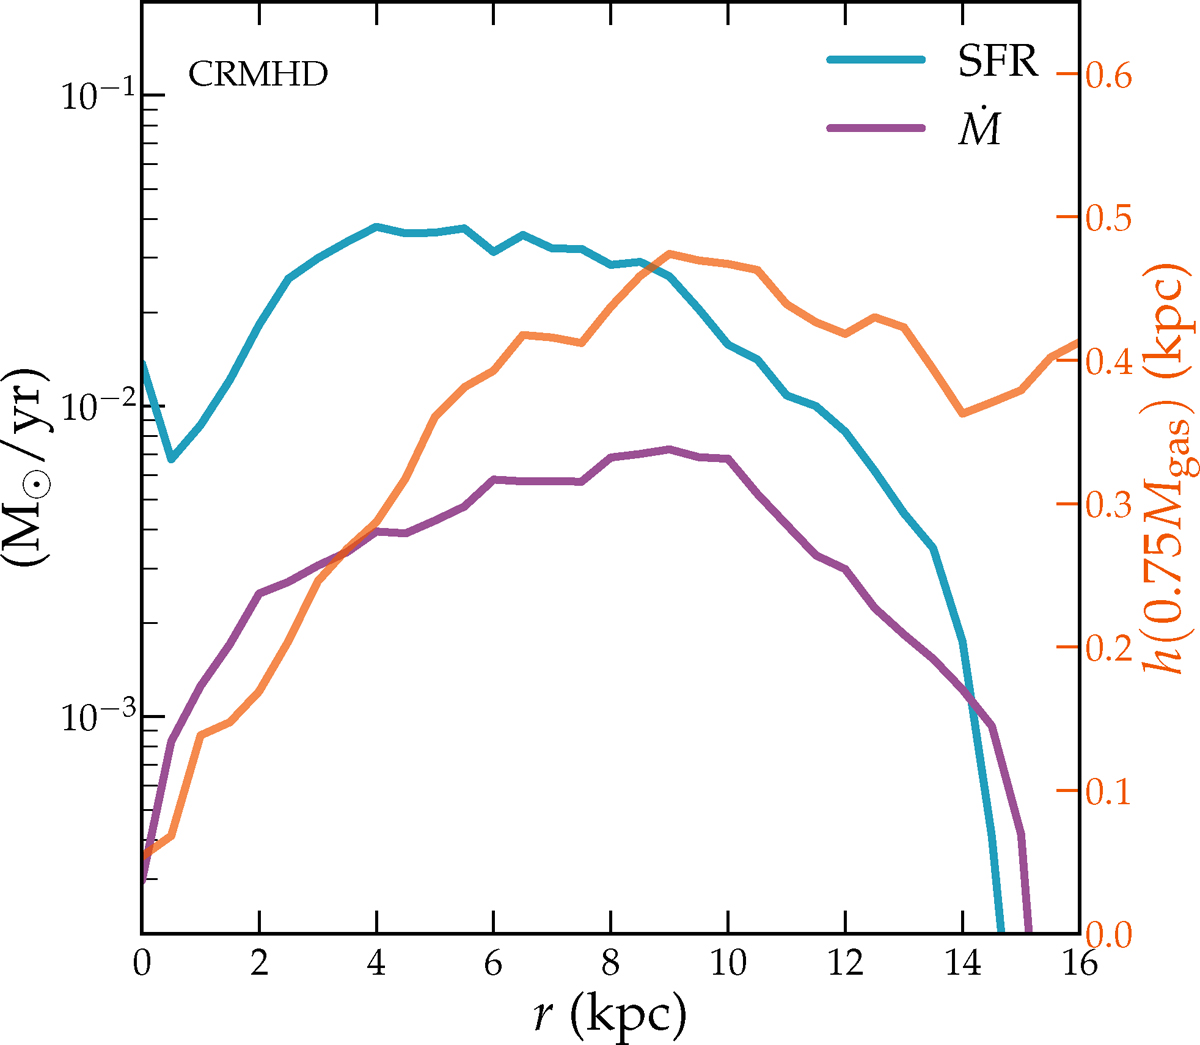
Fig. 11.
Download original image
Radial evolution of mass outflow rate, Ṁ, and SFR for the CRMHD simulation, averaged over t = 0.5 − 2.0 Gyr. The pink curve shows the gas scale height, h, averaged over the same time interval. Its values at the largest r imply that CRs lift gas at all radii, not just in the center.
Current usage metrics show cumulative count of Article Views (full-text article views including HTML views, PDF and ePub downloads, according to the available data) and Abstracts Views on Vision4Press platform.
Data correspond to usage on the plateform after 2015. The current usage metrics is available 48-96 hours after online publication and is updated daily on week days.
Initial download of the metrics may take a while.