Open Access
Fig. A.1.
Download original image
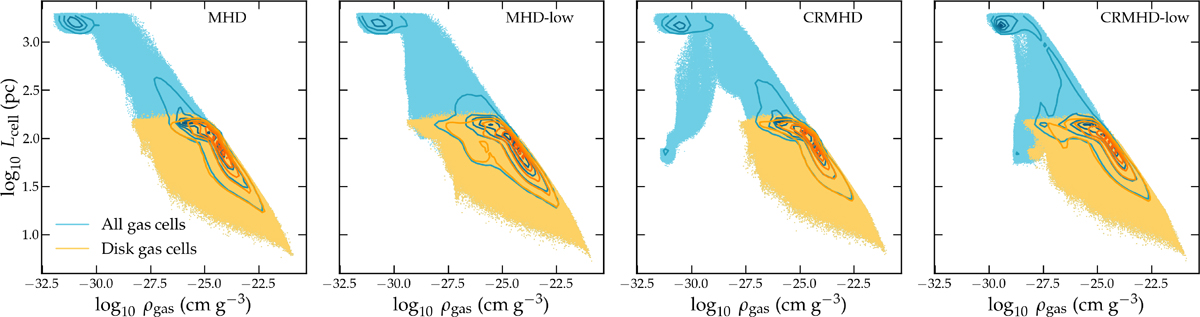
Cell length-density distribution of our simulations at t = 1.5 Gyr. In blue we plot all the gas cells, while in yellow only those belonging to the disk (r < 20 kpc, h < 1 kpc). The contours enclose 10%, 30%, 50%, 70%, and 90% of the cells in that region.
Current usage metrics show cumulative count of Article Views (full-text article views including HTML views, PDF and ePub downloads, according to the available data) and Abstracts Views on Vision4Press platform.
Data correspond to usage on the plateform after 2015. The current usage metrics is available 48-96 hours after online publication and is updated daily on week days.
Initial download of the metrics may take a while.